The product
Everything that's leaking, in dollars, across every outlet.
Backline reads sales, staff, stock and delivery-app fees from the systems you already run. It tells you what's off, what it's worth, and what to do next, with the work drafted for you to approve.
Today
Start every morning with the dollar list.
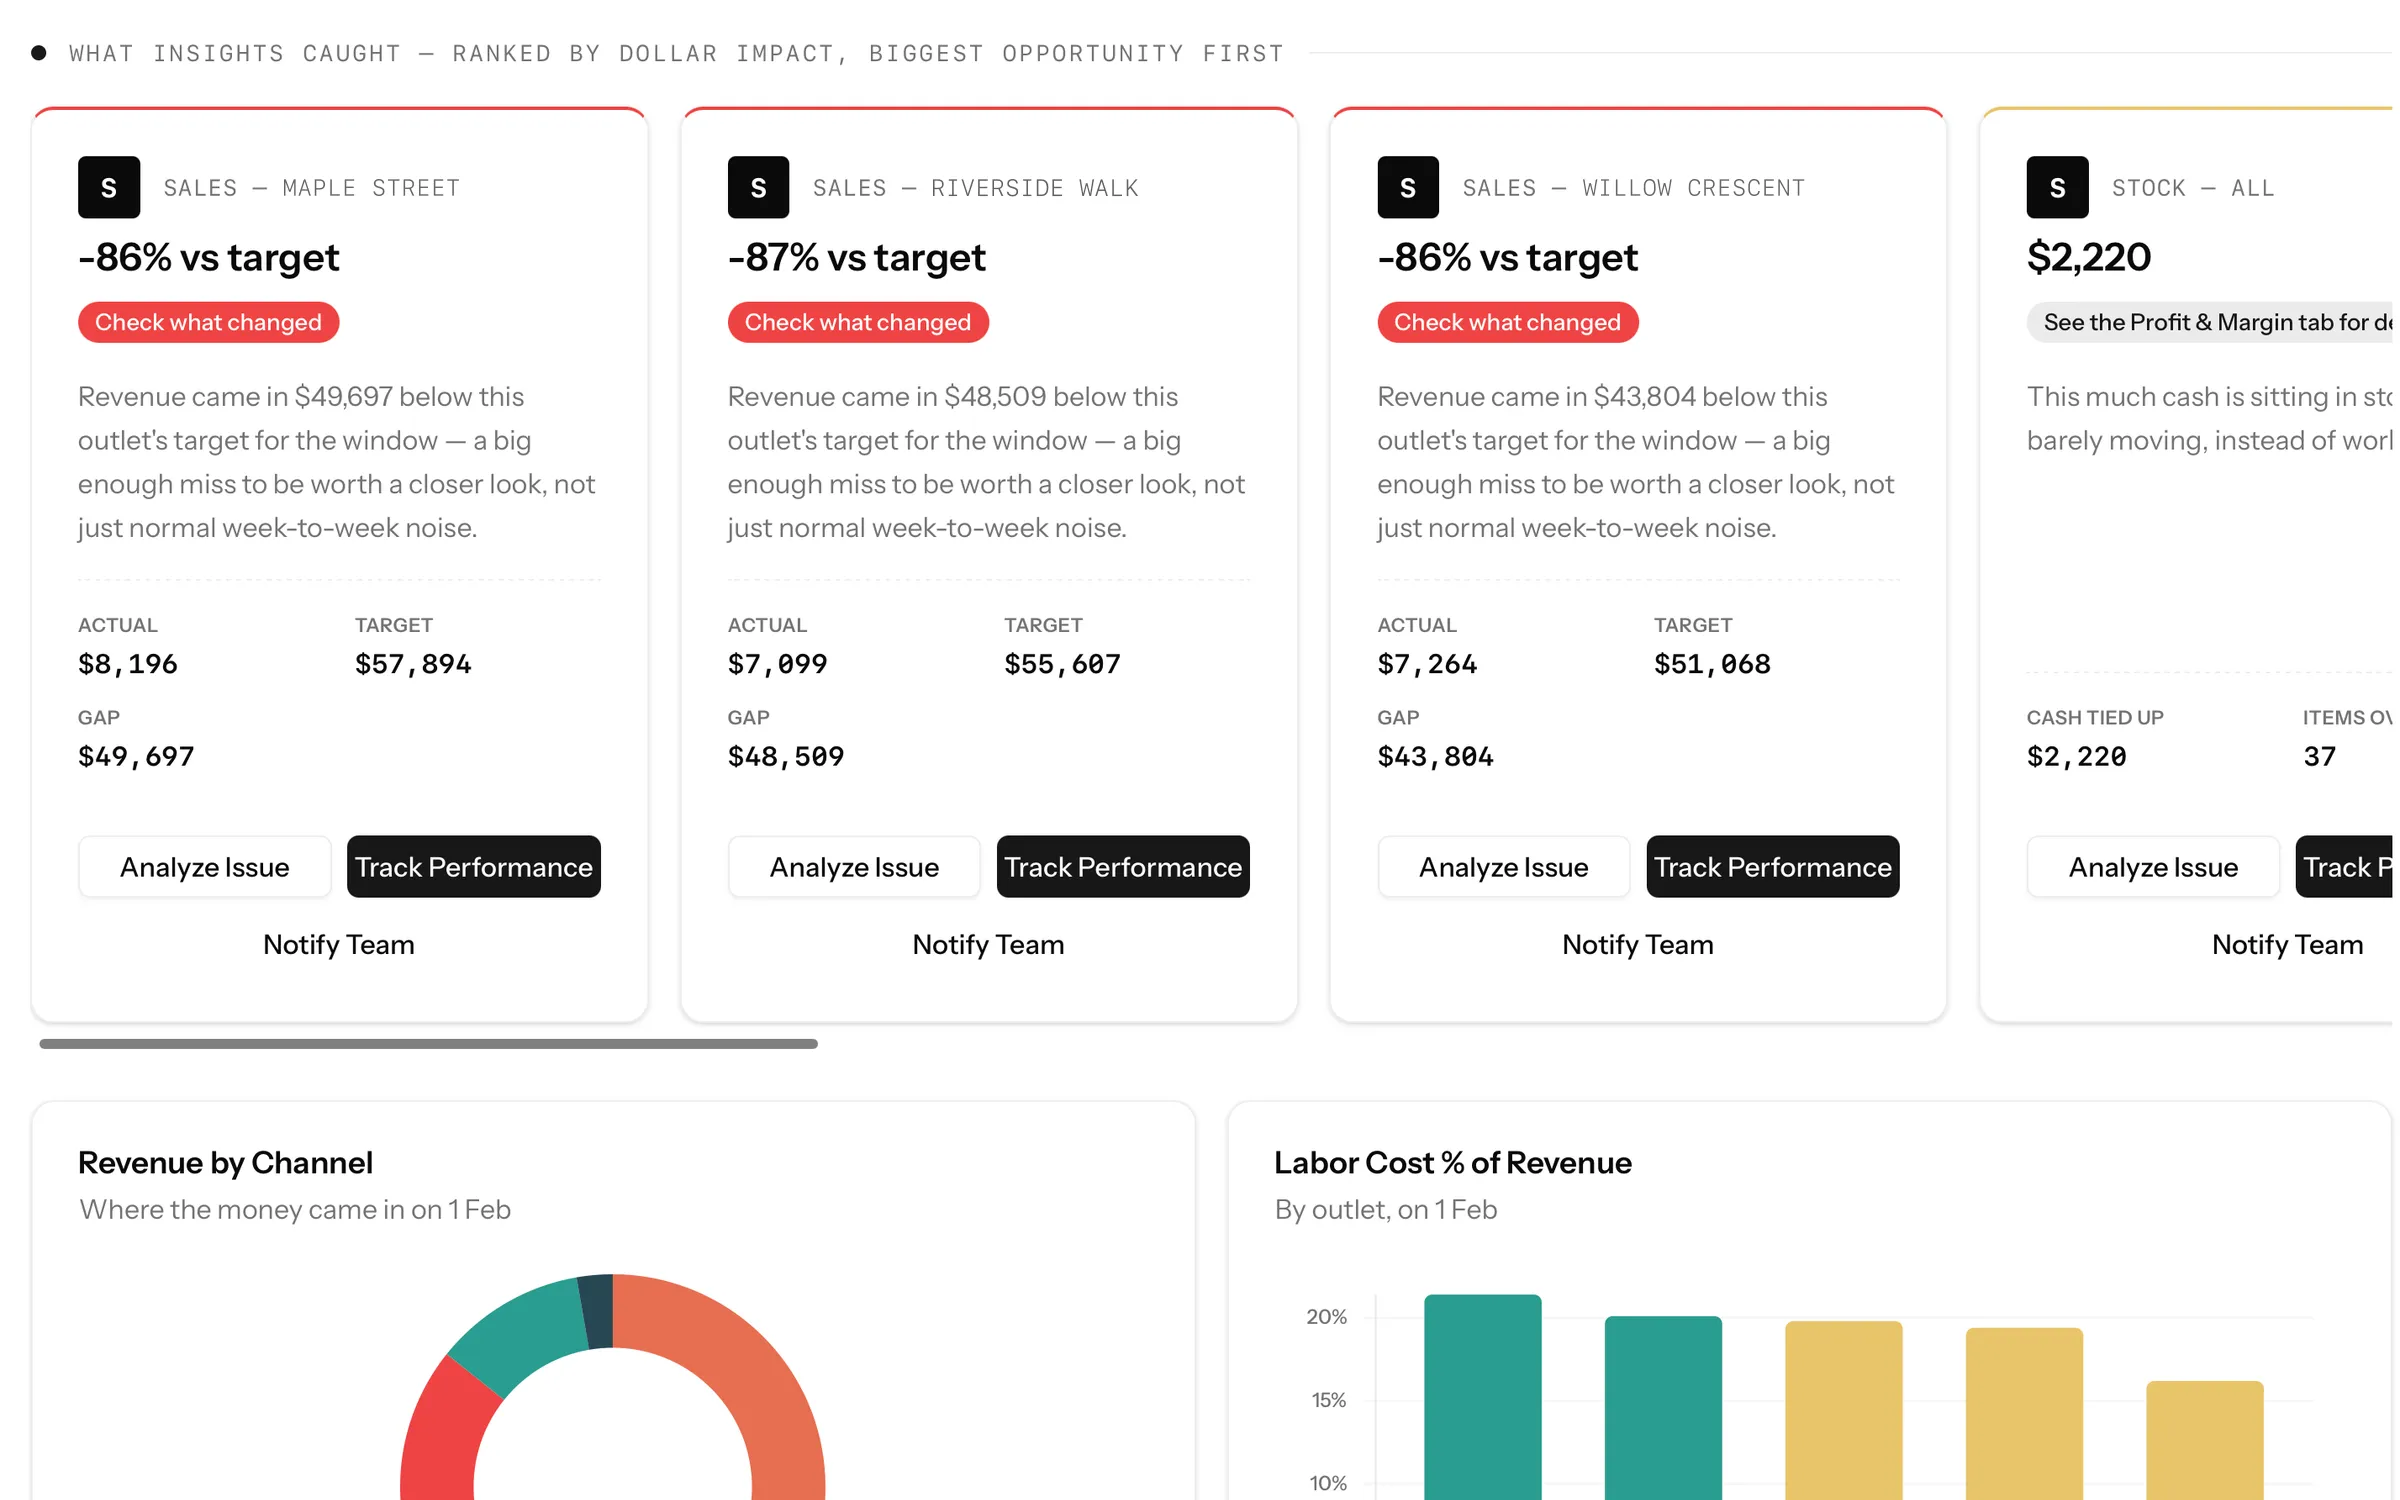
The first screen answers one question: what could you save or earn this month, and where? Every signal from every outlet is ranked by dollar impact, biggest first.
- One number up top: "$ you could save or earn this month", across all outlets or one.
- Ranked, not charted: a short list worth acting on, each item tied to an outlet and a reason.
- The Watchlist: track an issue and Backline keeps re-checking it. When the numbers recover, it flips to Resolved, so you know the fix worked instead of hoping it did.
What's selling
Turn "what sold" into what to stock, staff and promote.
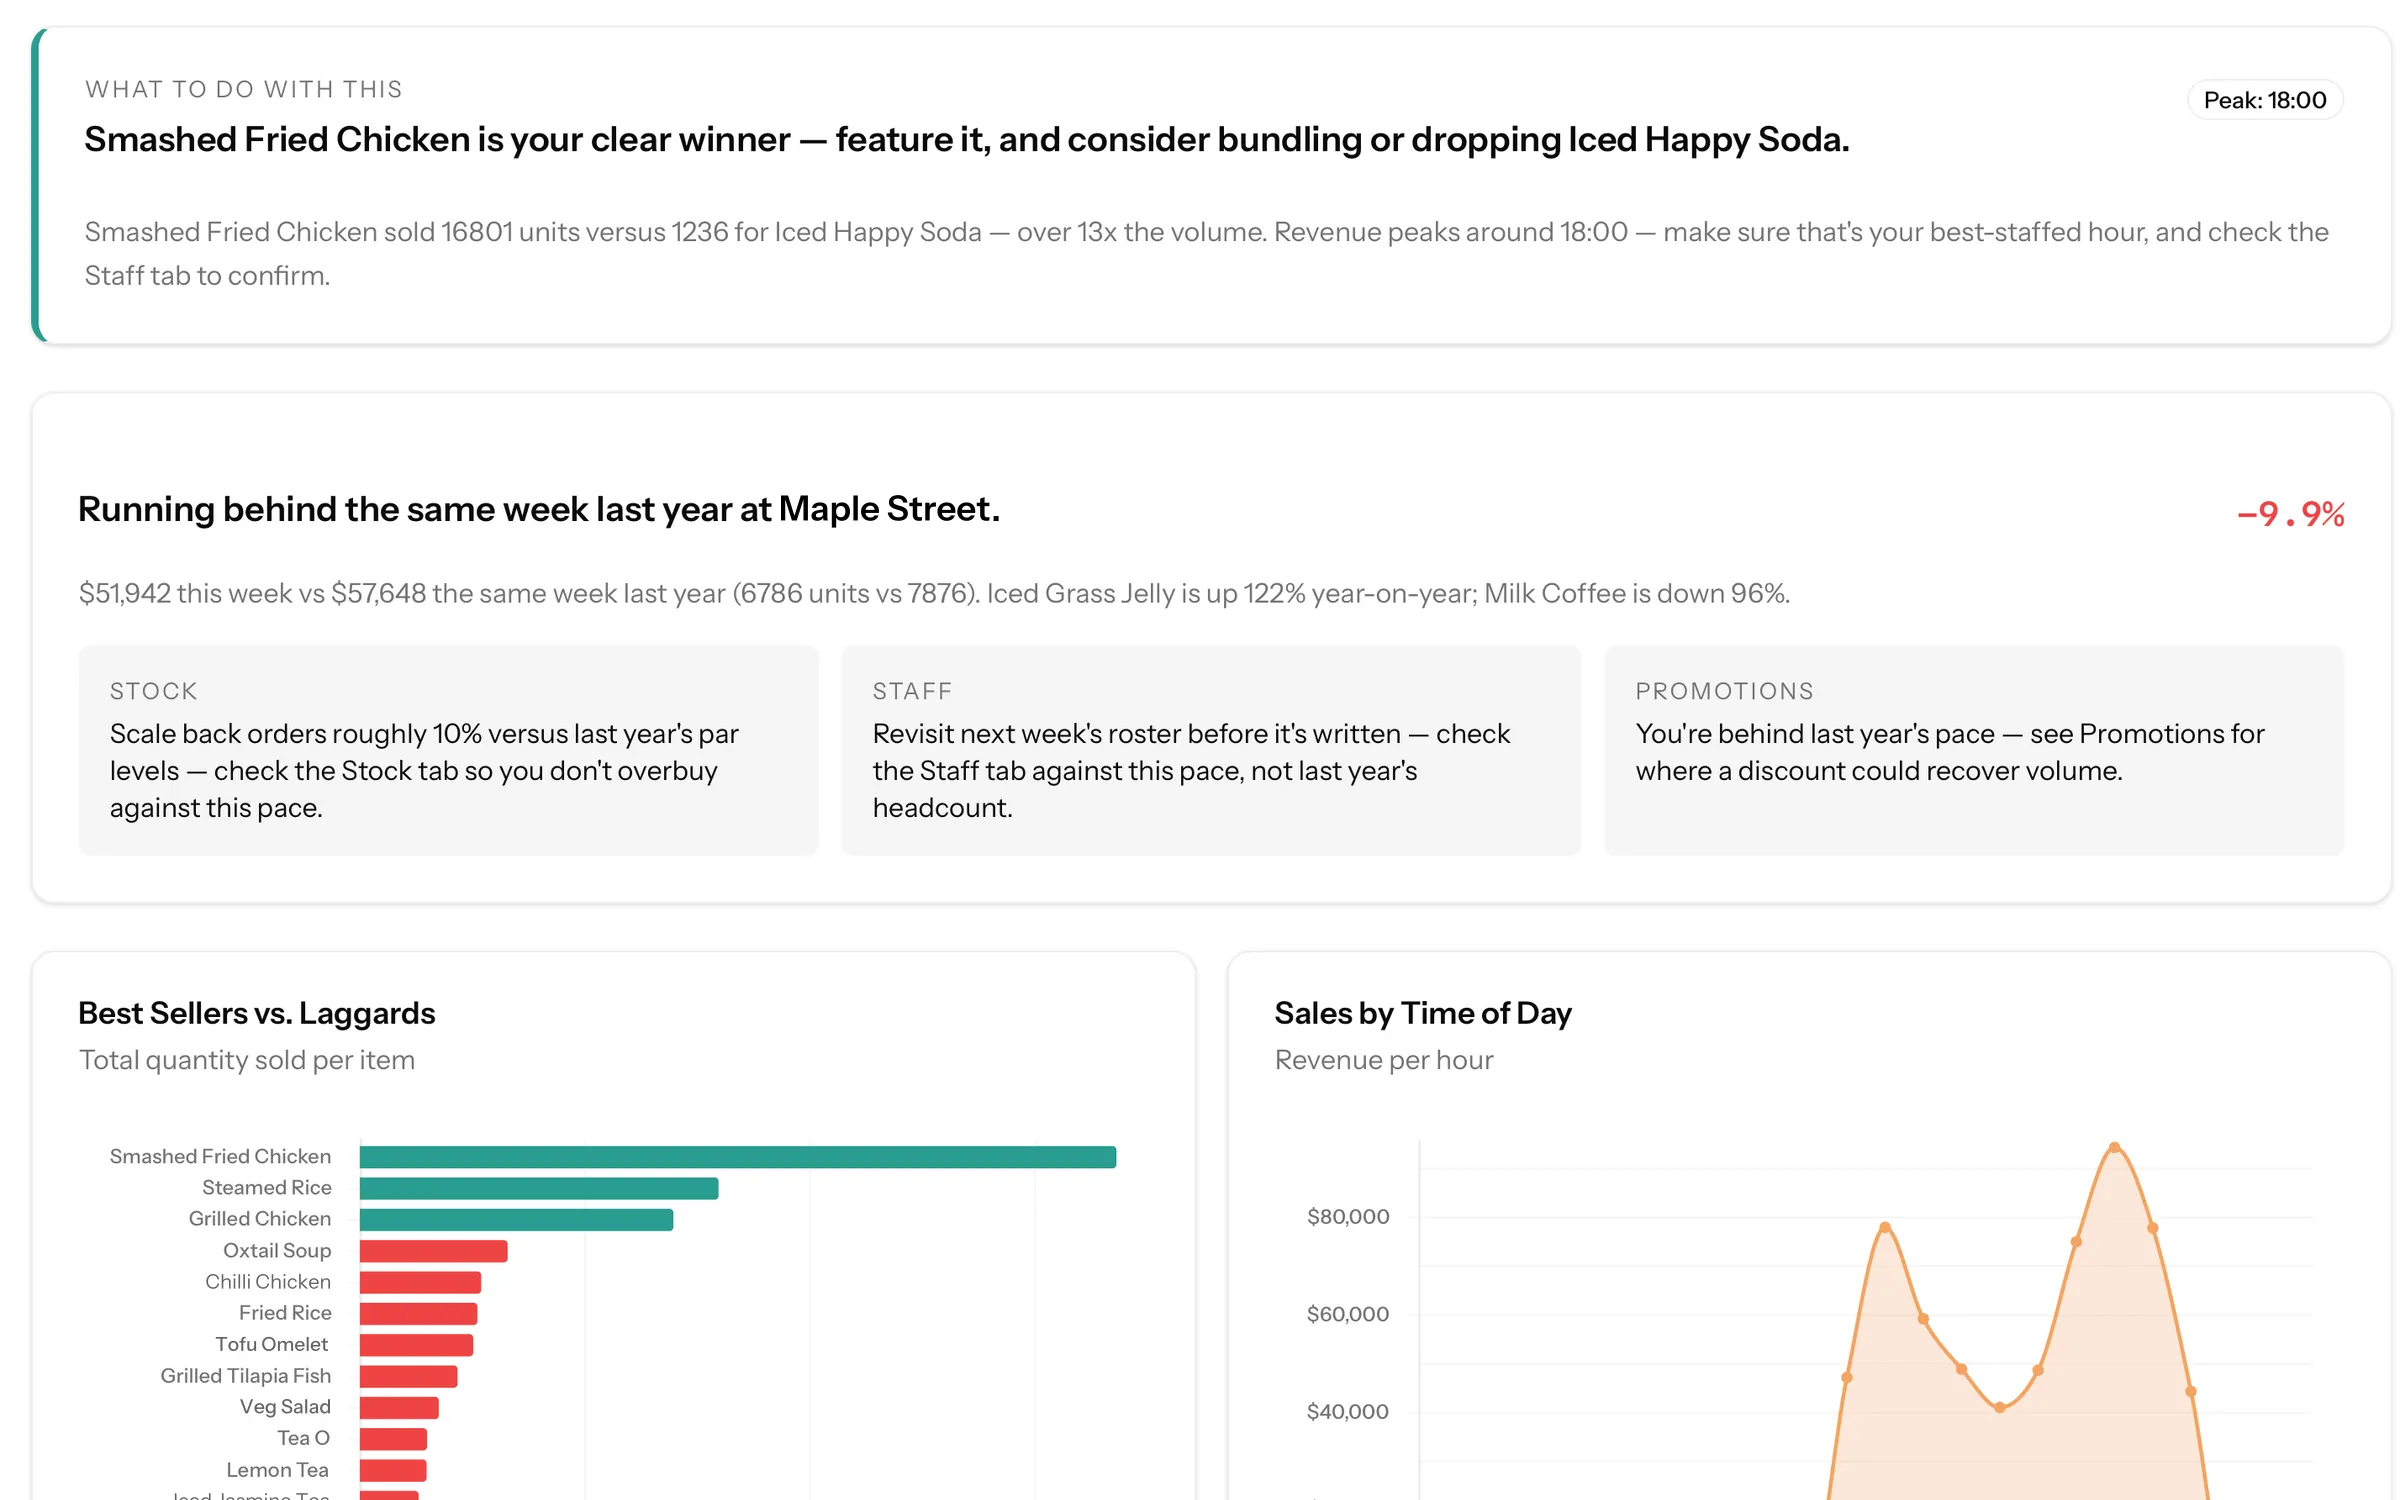
Best and worst sellers by outlet, and the hour each outlet actually peaks. Then Backline compares this year with last and turns the difference into directives you can act on.
- Best sellers and laggards, per outlet and across the group
- Peak hour per outlet: the number your roster and prep should be built around
- Year-over-year → directives: what changed since last year, translated into Stock, Staff and Promotion actions
Staff & roster
Know which outlet is overstaffed before payroll closes.
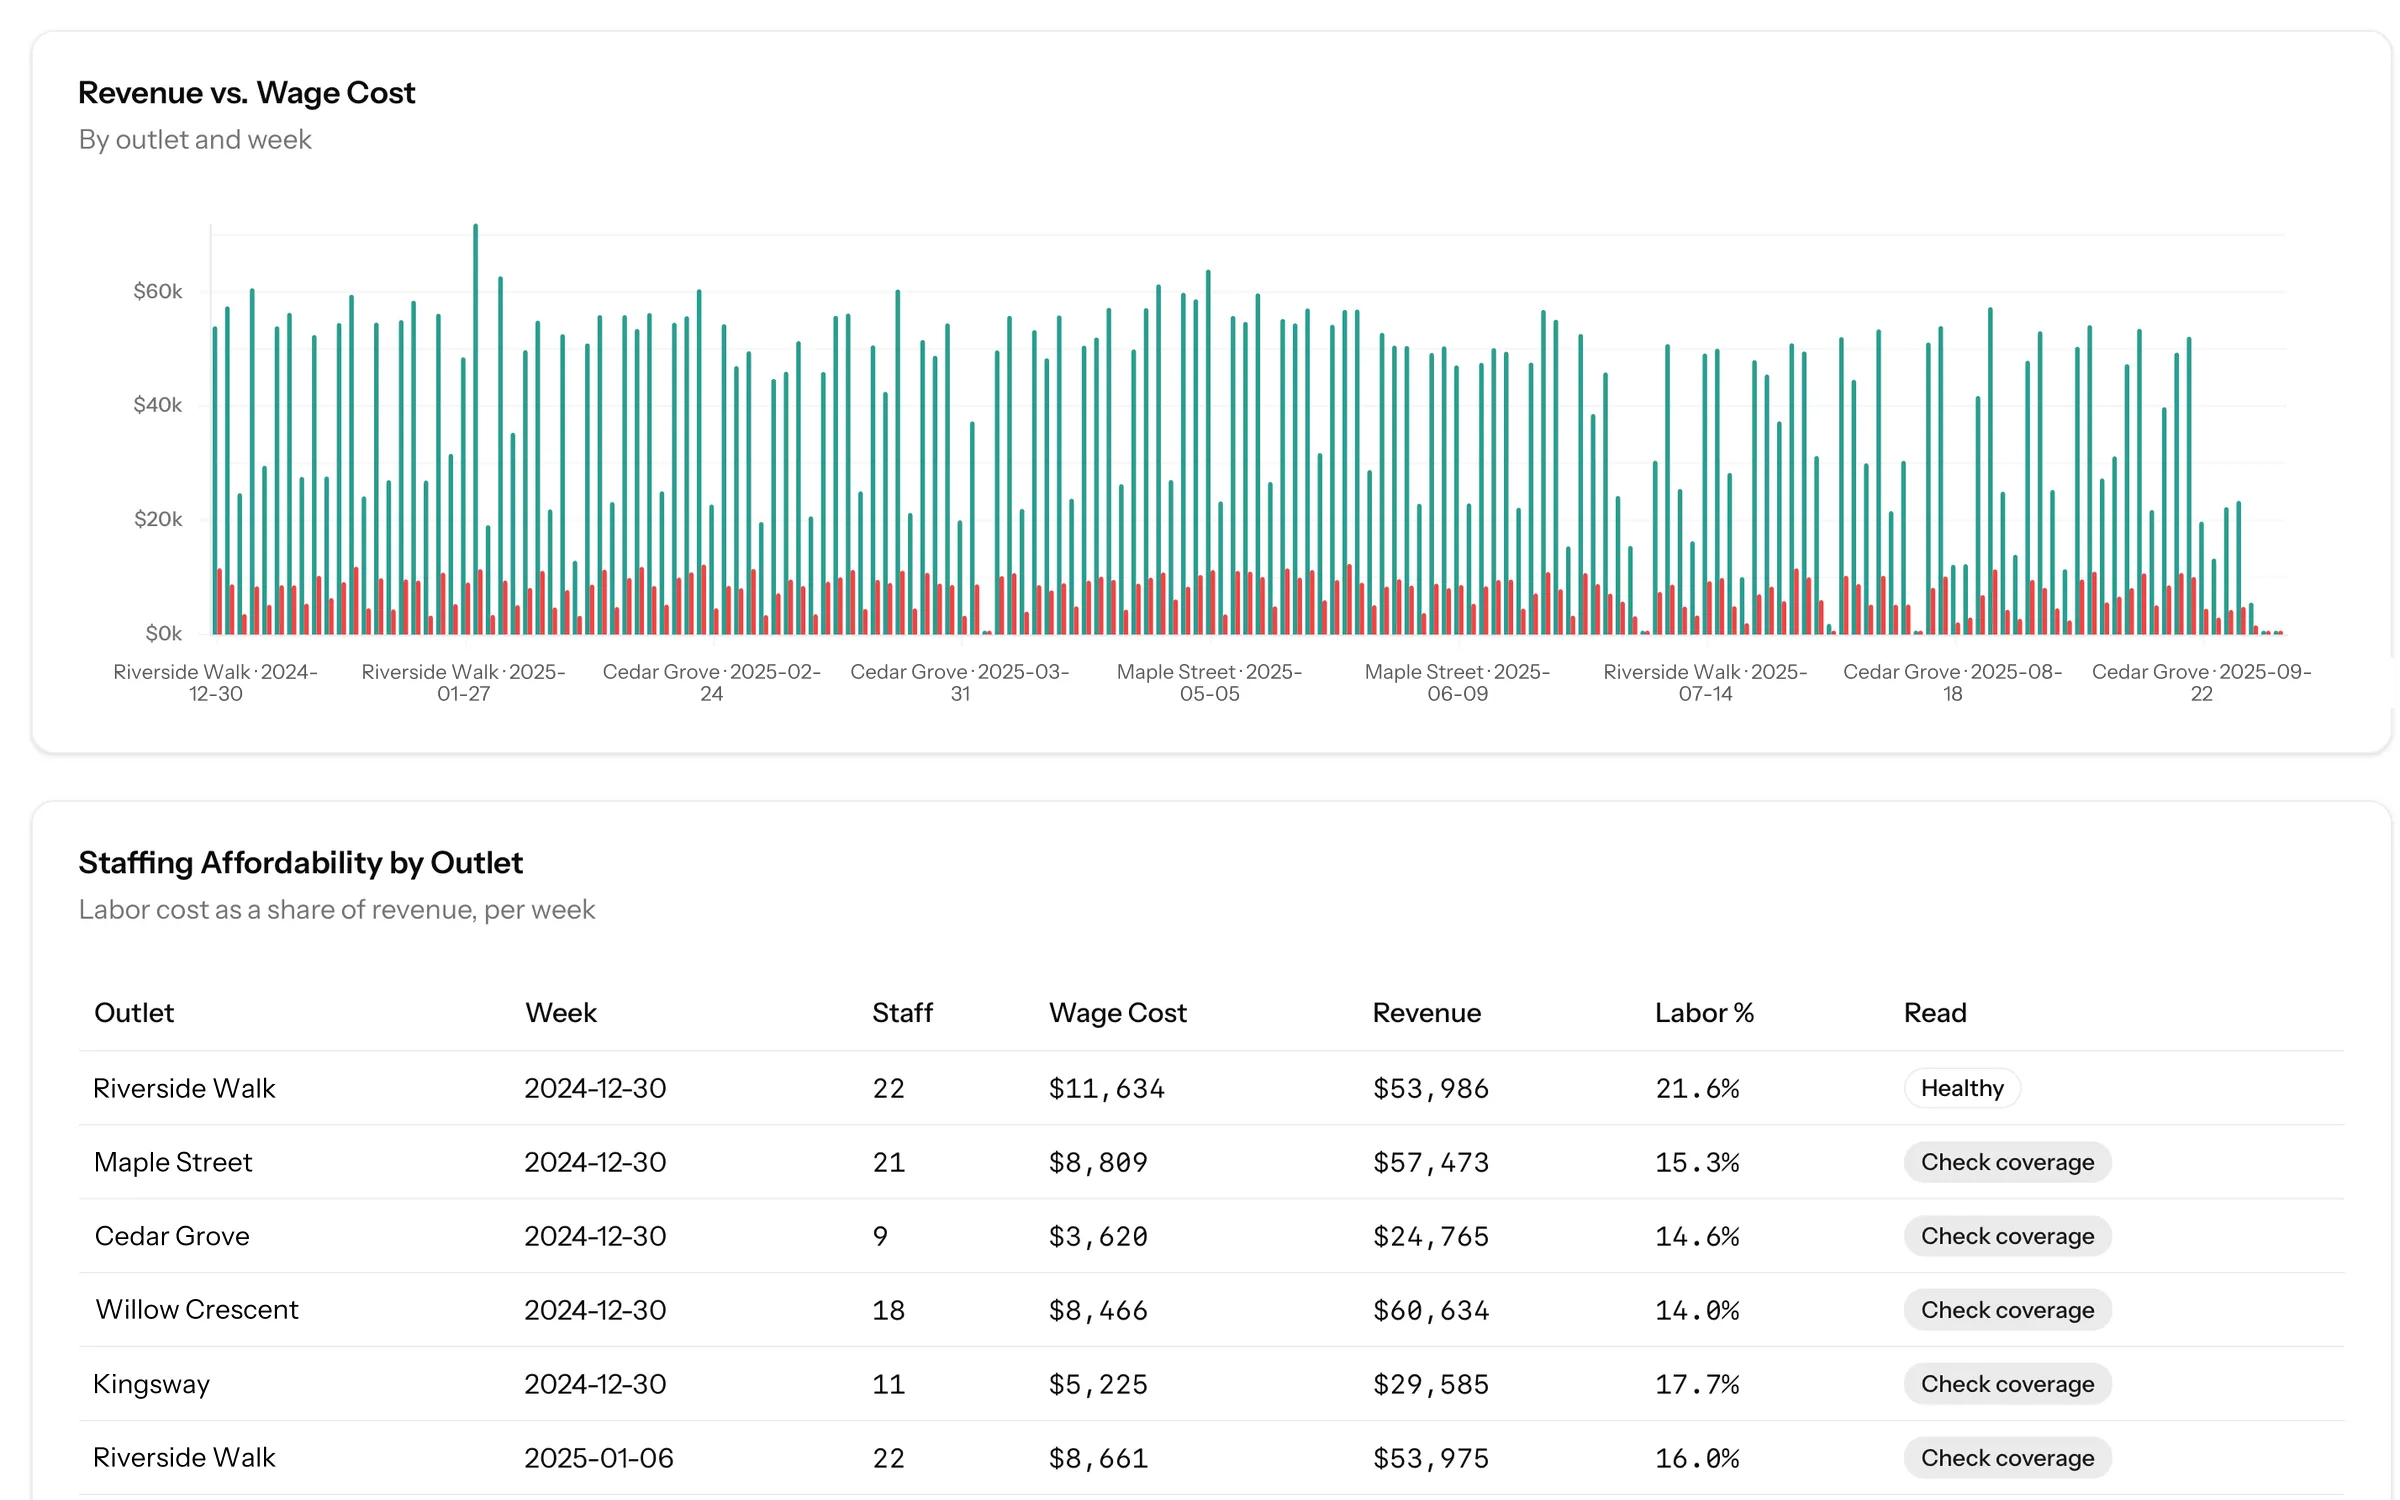
Labour % for every outlet, measured against a target band you set (default 28–32%). When an outlet drifts outside it, Backline works out the staff hours that would bring it back and drafts the note for your ops manager.
- Labour % vs your target band, by outlet, by week
- Draft Roster Adjustment: a staff-hours target plus a ready-to-paste note for your ops manager
- Shift-level roster in week and month views, checked against each outlet's real sales peak
- Schedule vs payroll: flags the gap between hours rostered and hours paid
You approveThe roster note is copy-to-clipboard. Backline never changes a roster or messages staff.
Service speed
Fully staffed and still slow? It might be the kitchen.
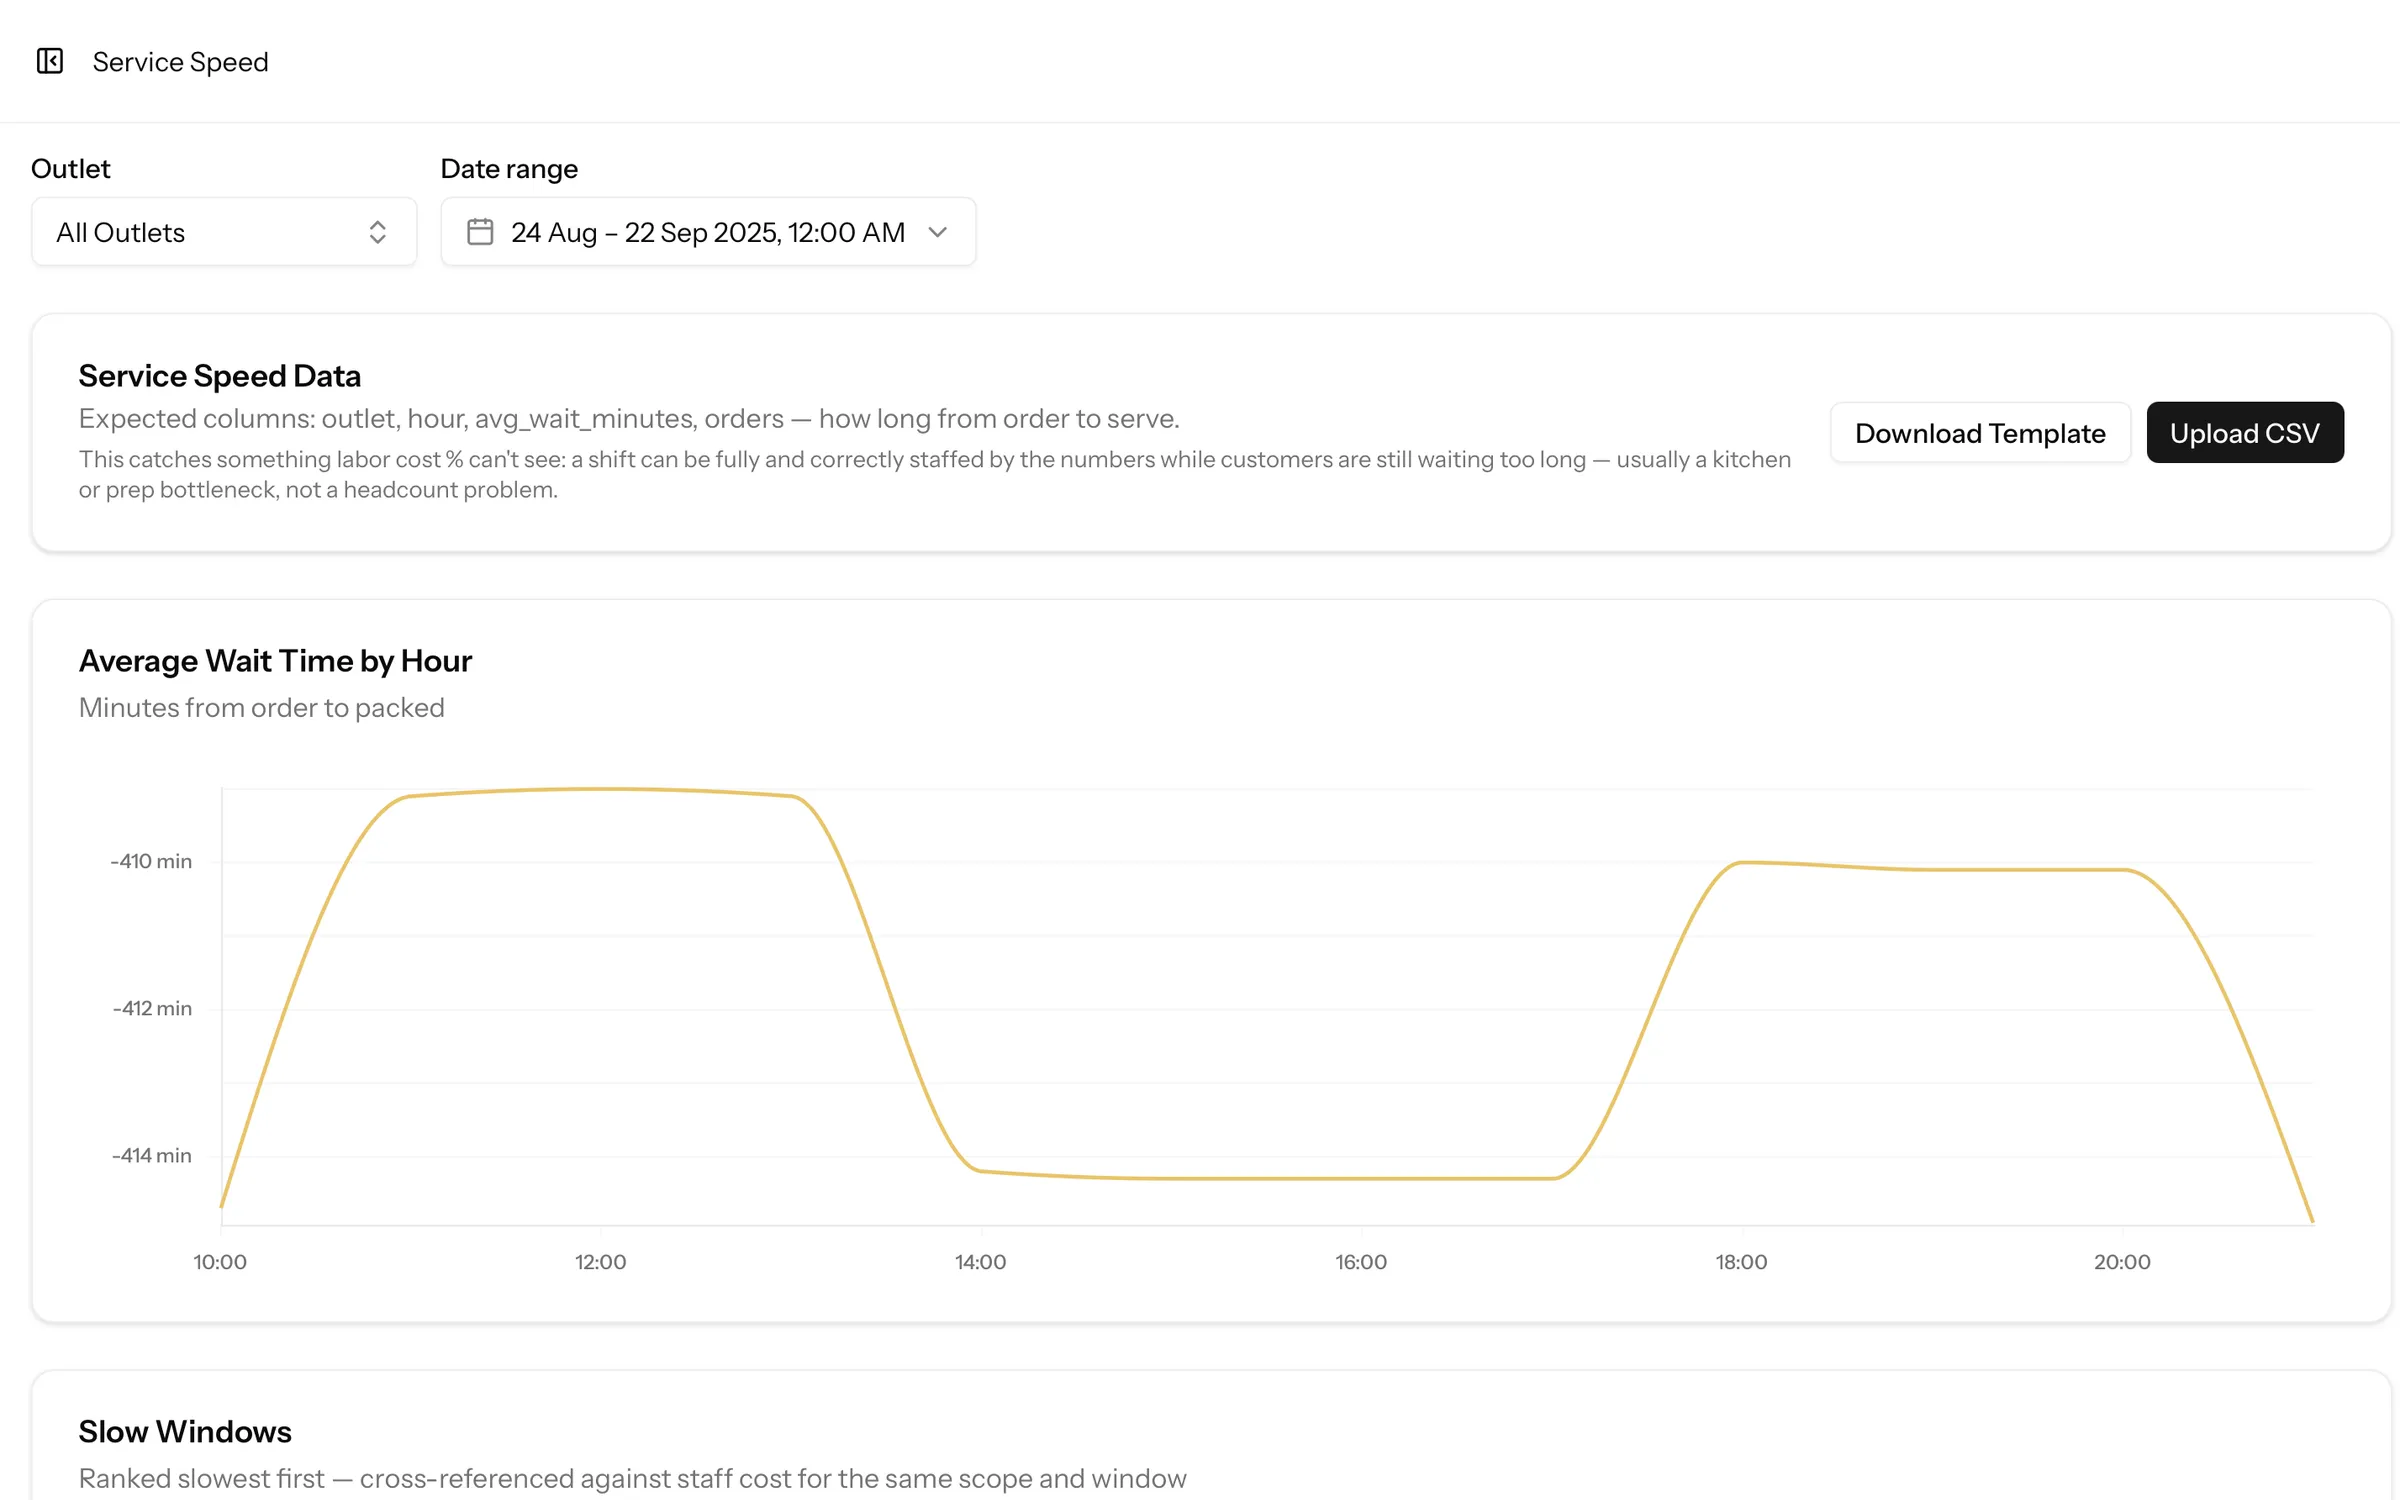
A shift can be correctly staffed by the numbers while customers still wait too long. Backline puts average order-to-serve time by hour next to who was on shift, so a prep or kitchen bottleneck doesn't get mistaken for a headcount problem.
- Average wait time by hour, per outlet
- Slow windows shown beside staffing at that hour
- The question it answers: hire more hands, or fix the line?
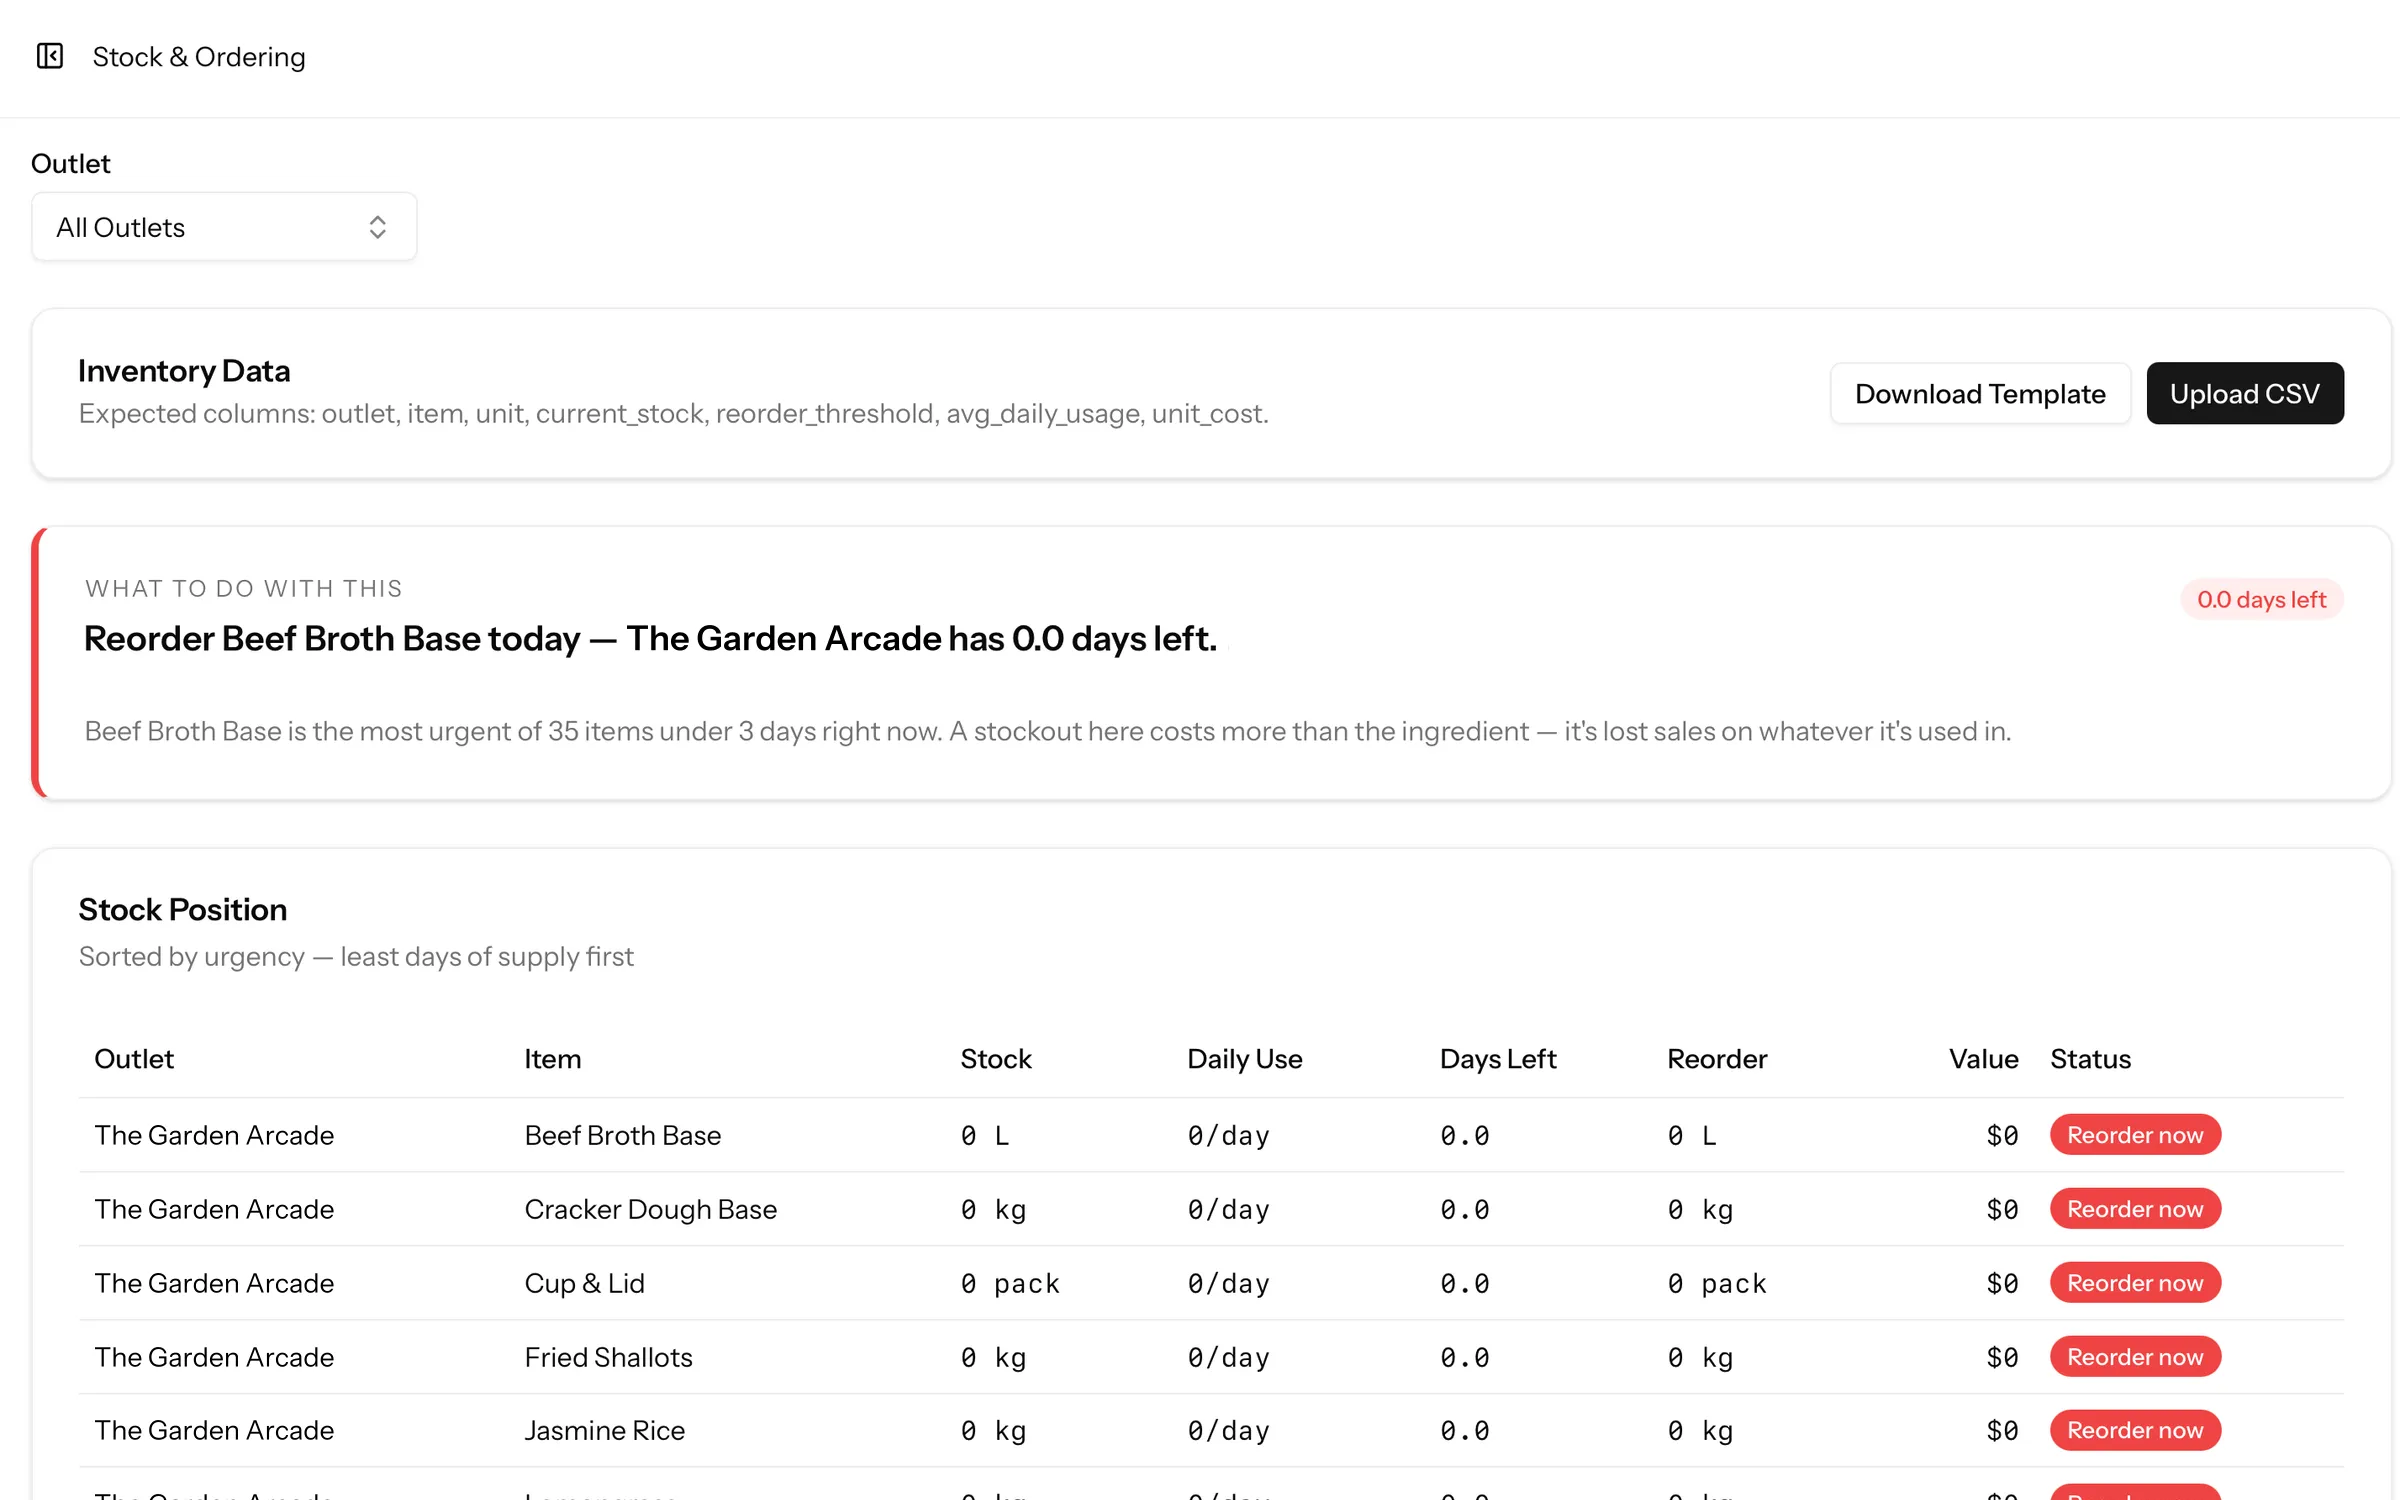
Stock & ordering
Order to how each outlet actually sells.
Most groups order evenly across the day. Customers don't buy evenly. Backline ranks stock by urgency and matches order timing to when each item really sells.
- Stock ranked by urgency: days left, reorder point, what's tying up cash
- AM/PM order timing: where even morning and afternoon orders leave stale prep early or sell-outs late
- Draft RFQ: compares your suppliers on price and lead time, with its reasoning shown
You approveThe RFQ is copy-to-clipboard. Nothing is ever sent to a supplier automatically.
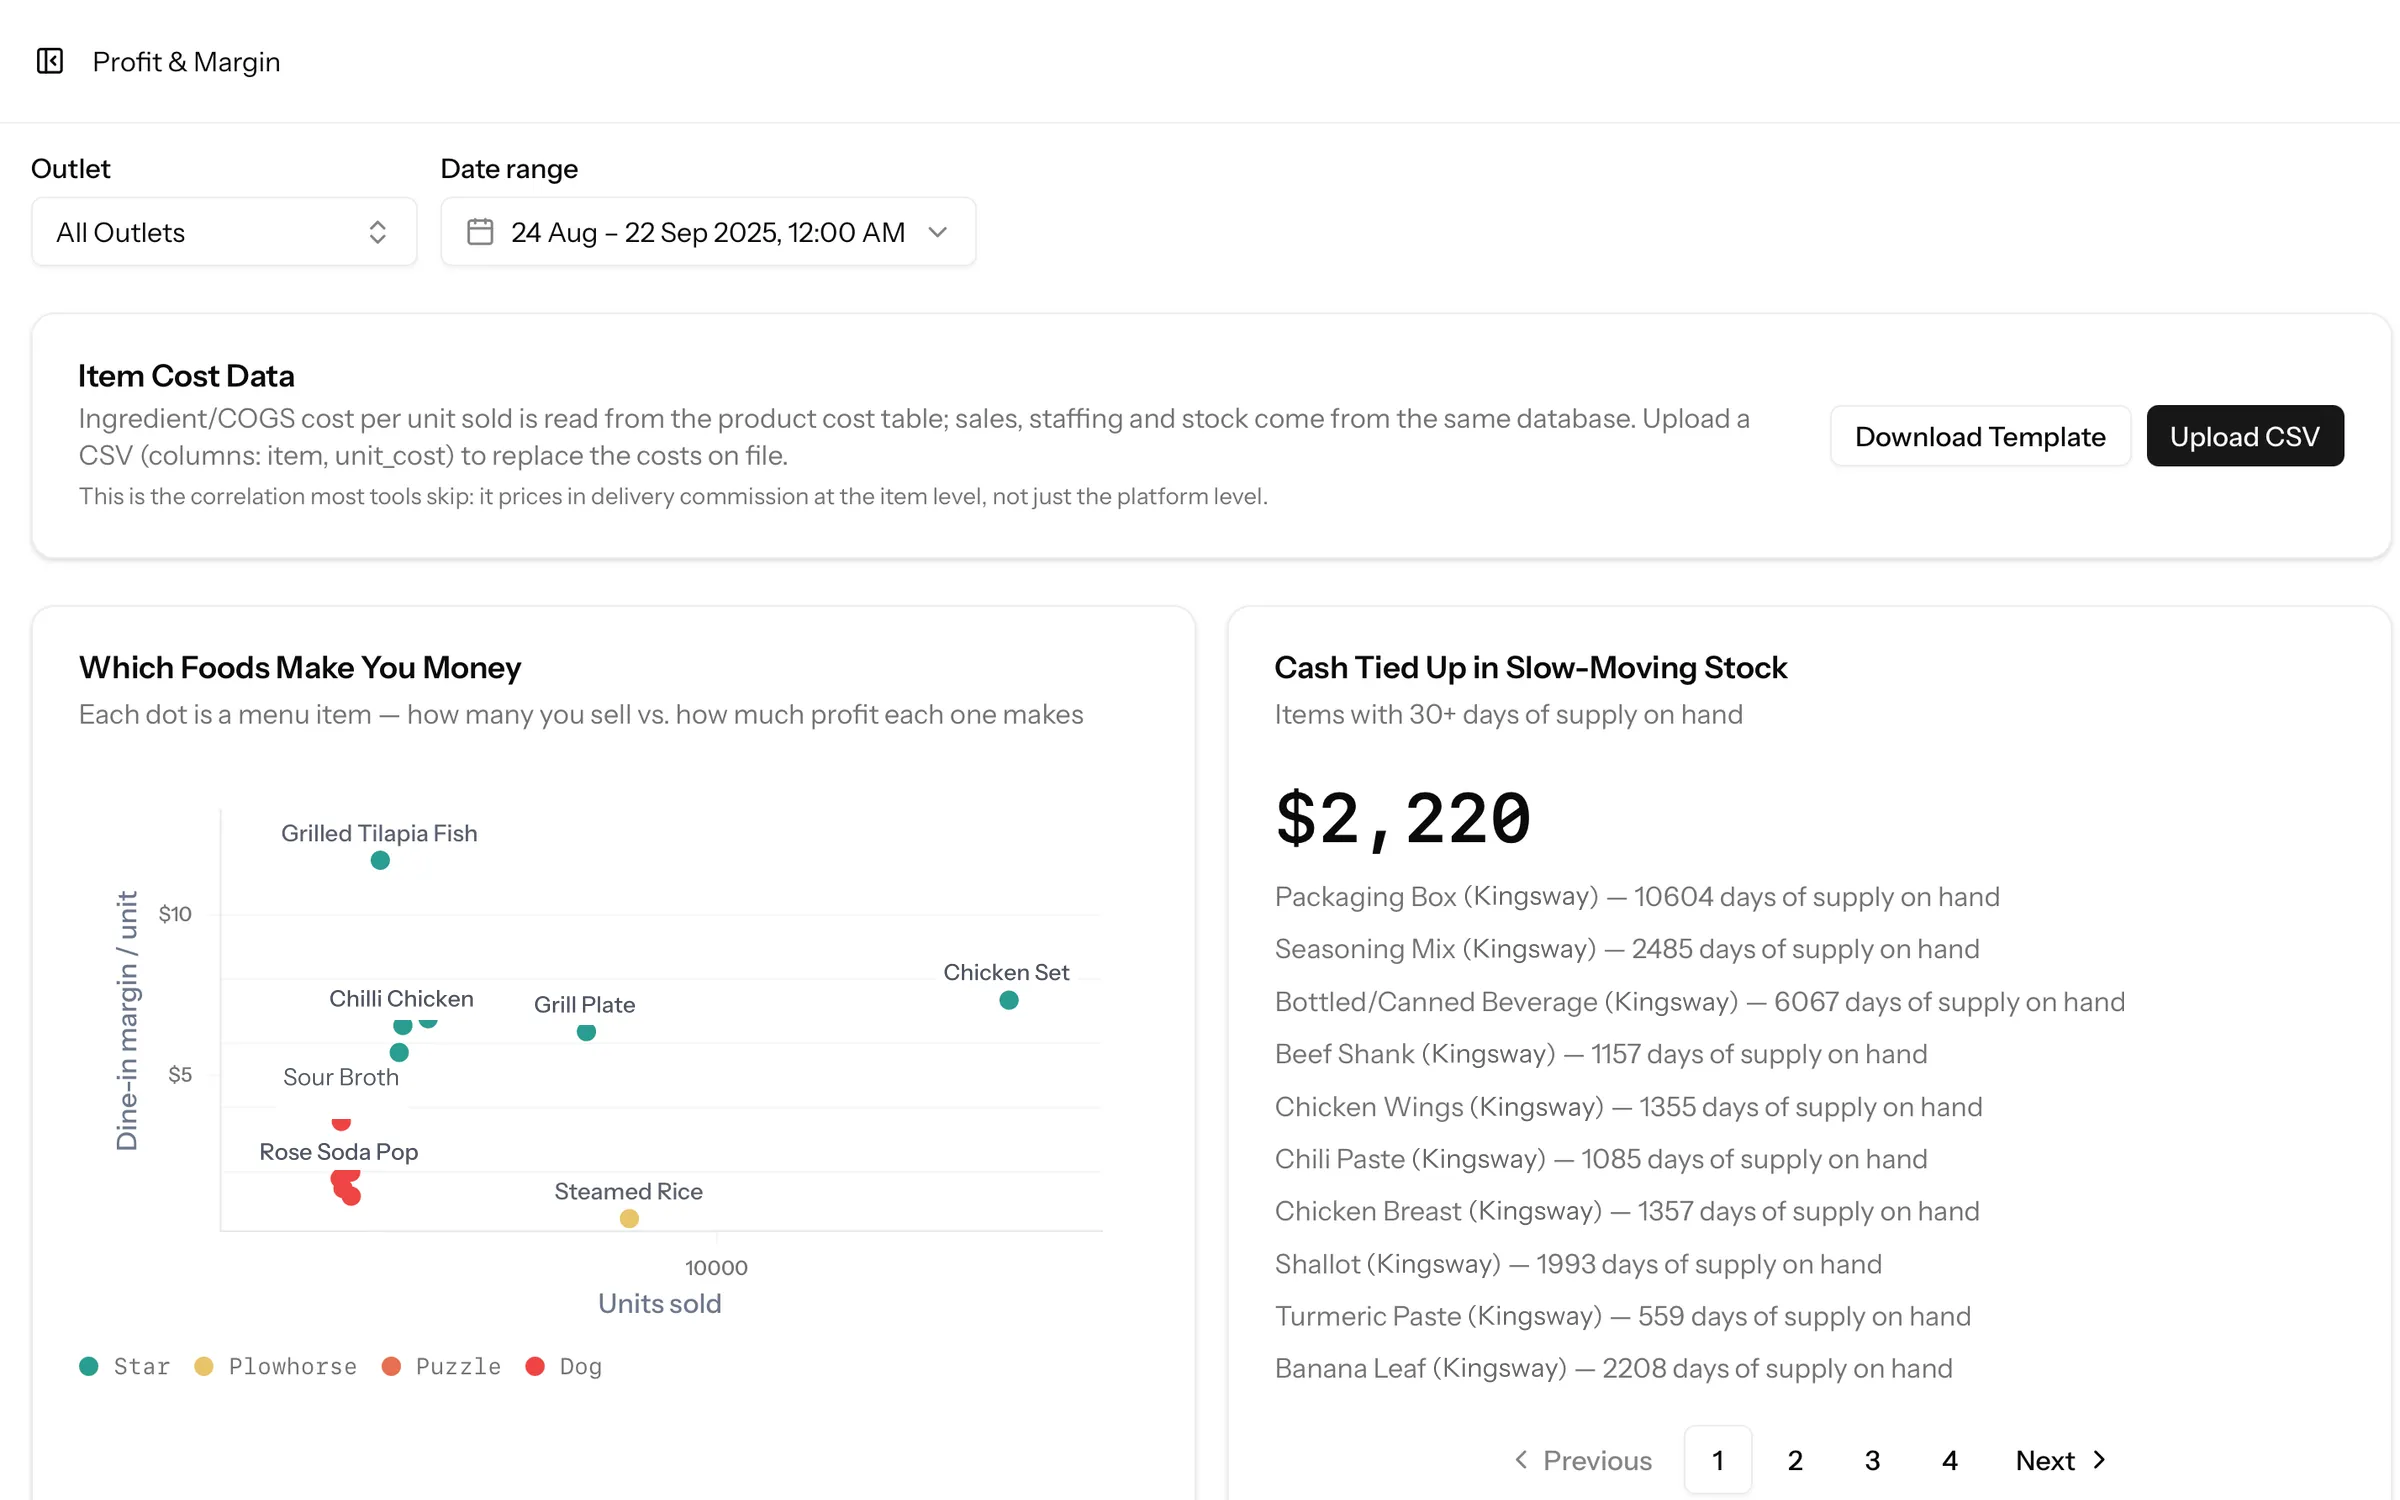
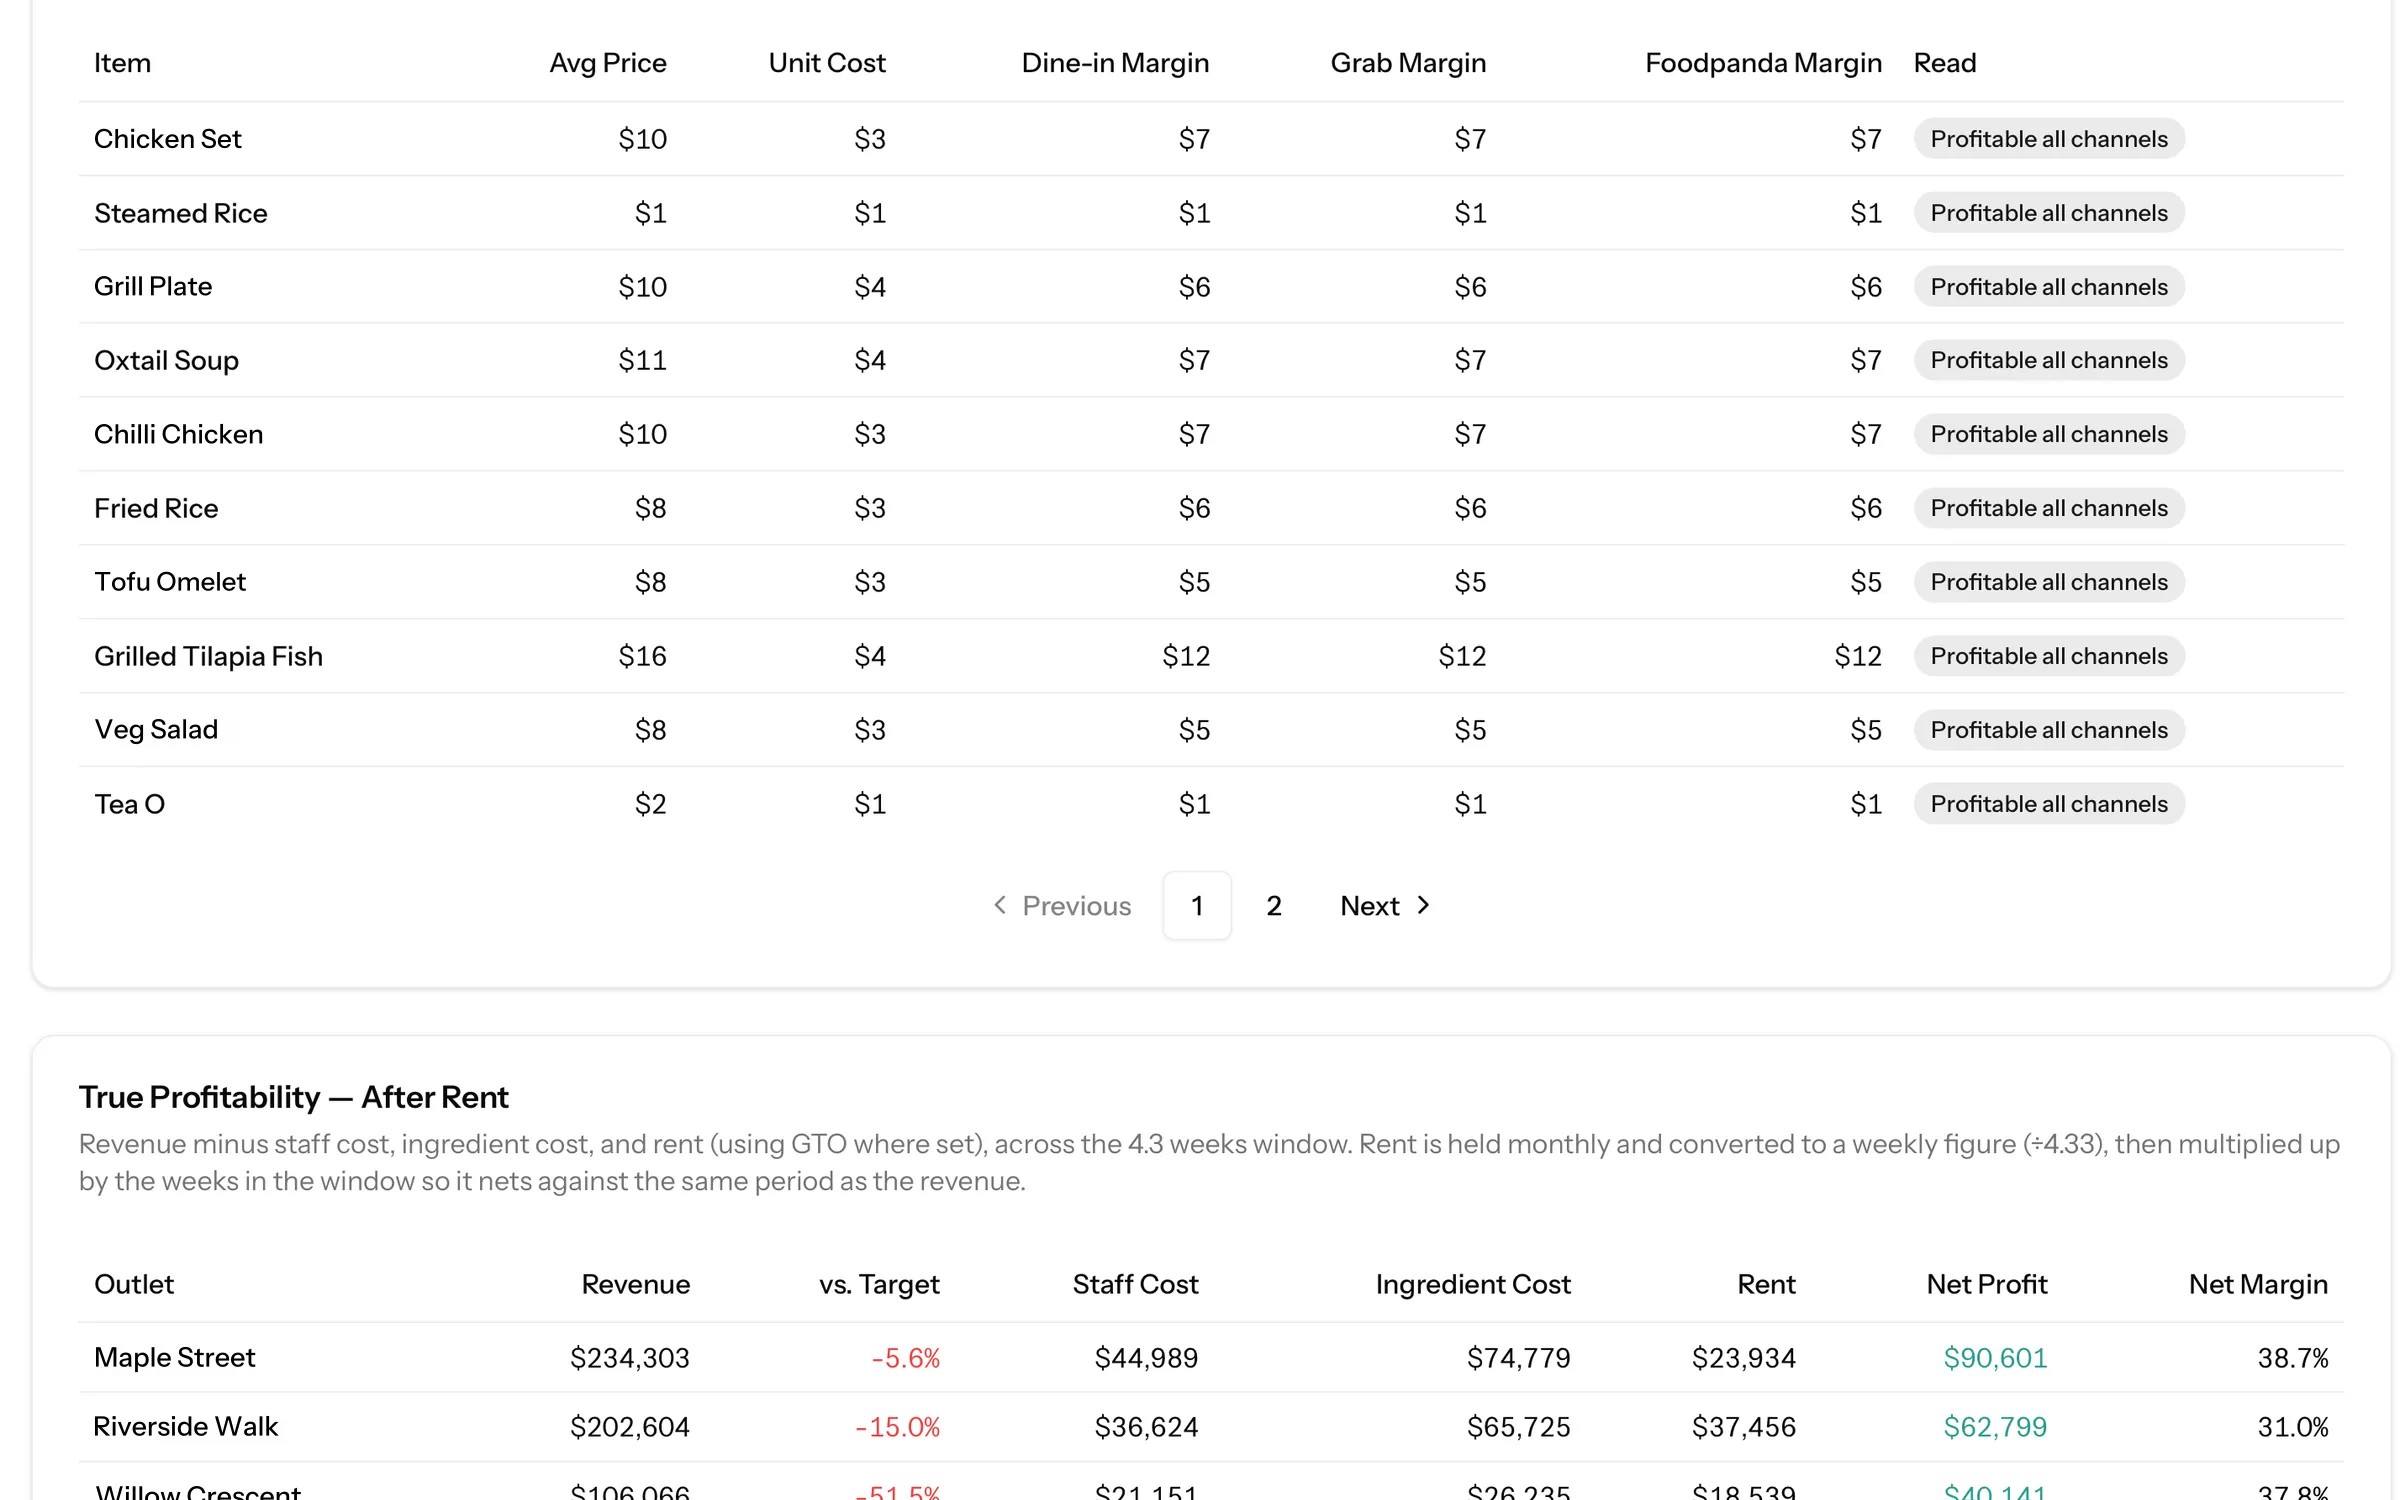
Profit & margin
See what each outlet makes, after everything.
Revenue is the easy number. Backline takes it down to profit, item by item and outlet by outlet.
- Delivery-adjusted item margin: after ingredient cost and your actual platform commission rates, per channel. Commission rates vary by platform and contract. Backline uses your actual rates, not an industry average.
- Outlet profit after staff, rent (including gross-turnover leases), utilities and other fixed costs
- Work backward from a target: set the weekly profit you want, and Backline shows the sales each outlet needs to get there
Pricing & promotions
Raise prices where you can. Discount only where it pays.
One engine, two directions. It reads each outlet's pace against target and recommends a move, always with its reasoning, a 7-day test window and a margin floor.
- Pacing ahead? It recommends a price increase, and shows where demand can carry it.
- Running behind? It recommends calendar-aware discounts or bundles timed to real dates.
- Never blind: every recommendation shows its working, runs as a 7-day test, and respects a margin floor you set.
You approveNo price changes in your POS. You decide what runs.
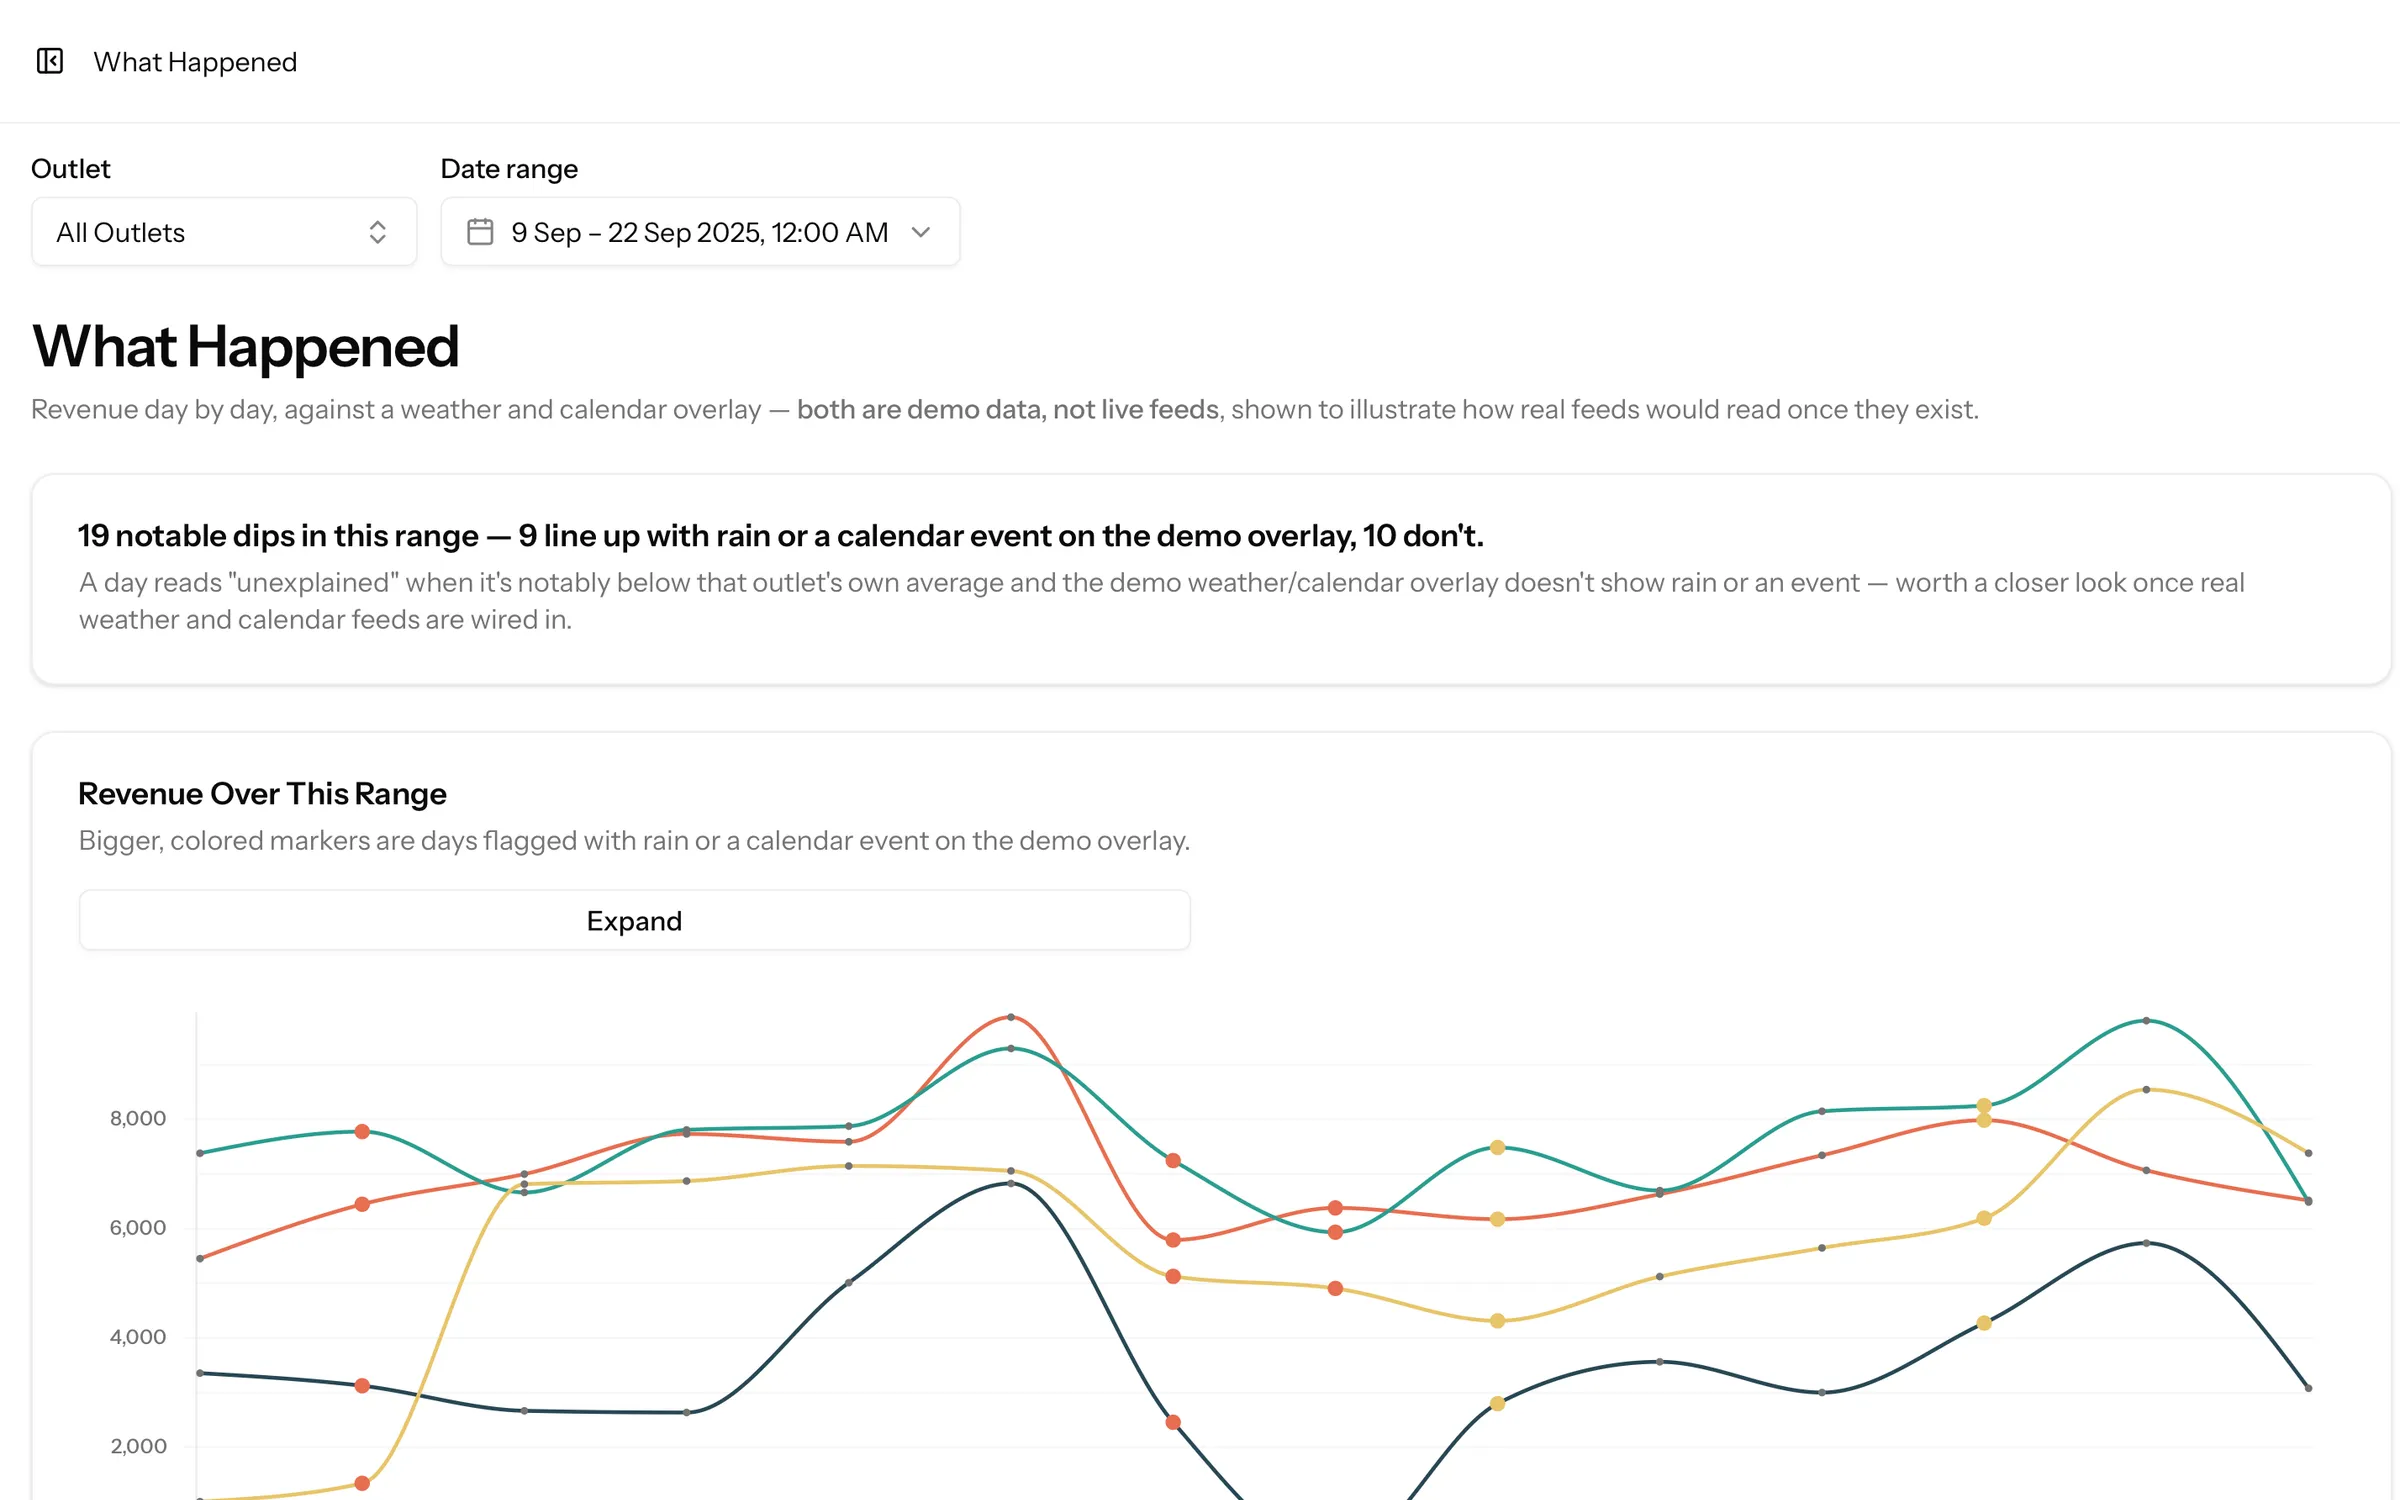
What happened
Know whether a bad day was the weather or something worth fixing.
Pick a date range and see each outlet's revenue against its own average, beside the weather and calendar events for those days. A dip that lines up with a storm reads differently from one that doesn't.
- Revenue vs the outlet's own average, day by day
- Weather and calendar events alongside
- Unexplained dips flagged "worth investigating"
Customers
Notice when a regular stops coming in, while it still matters.
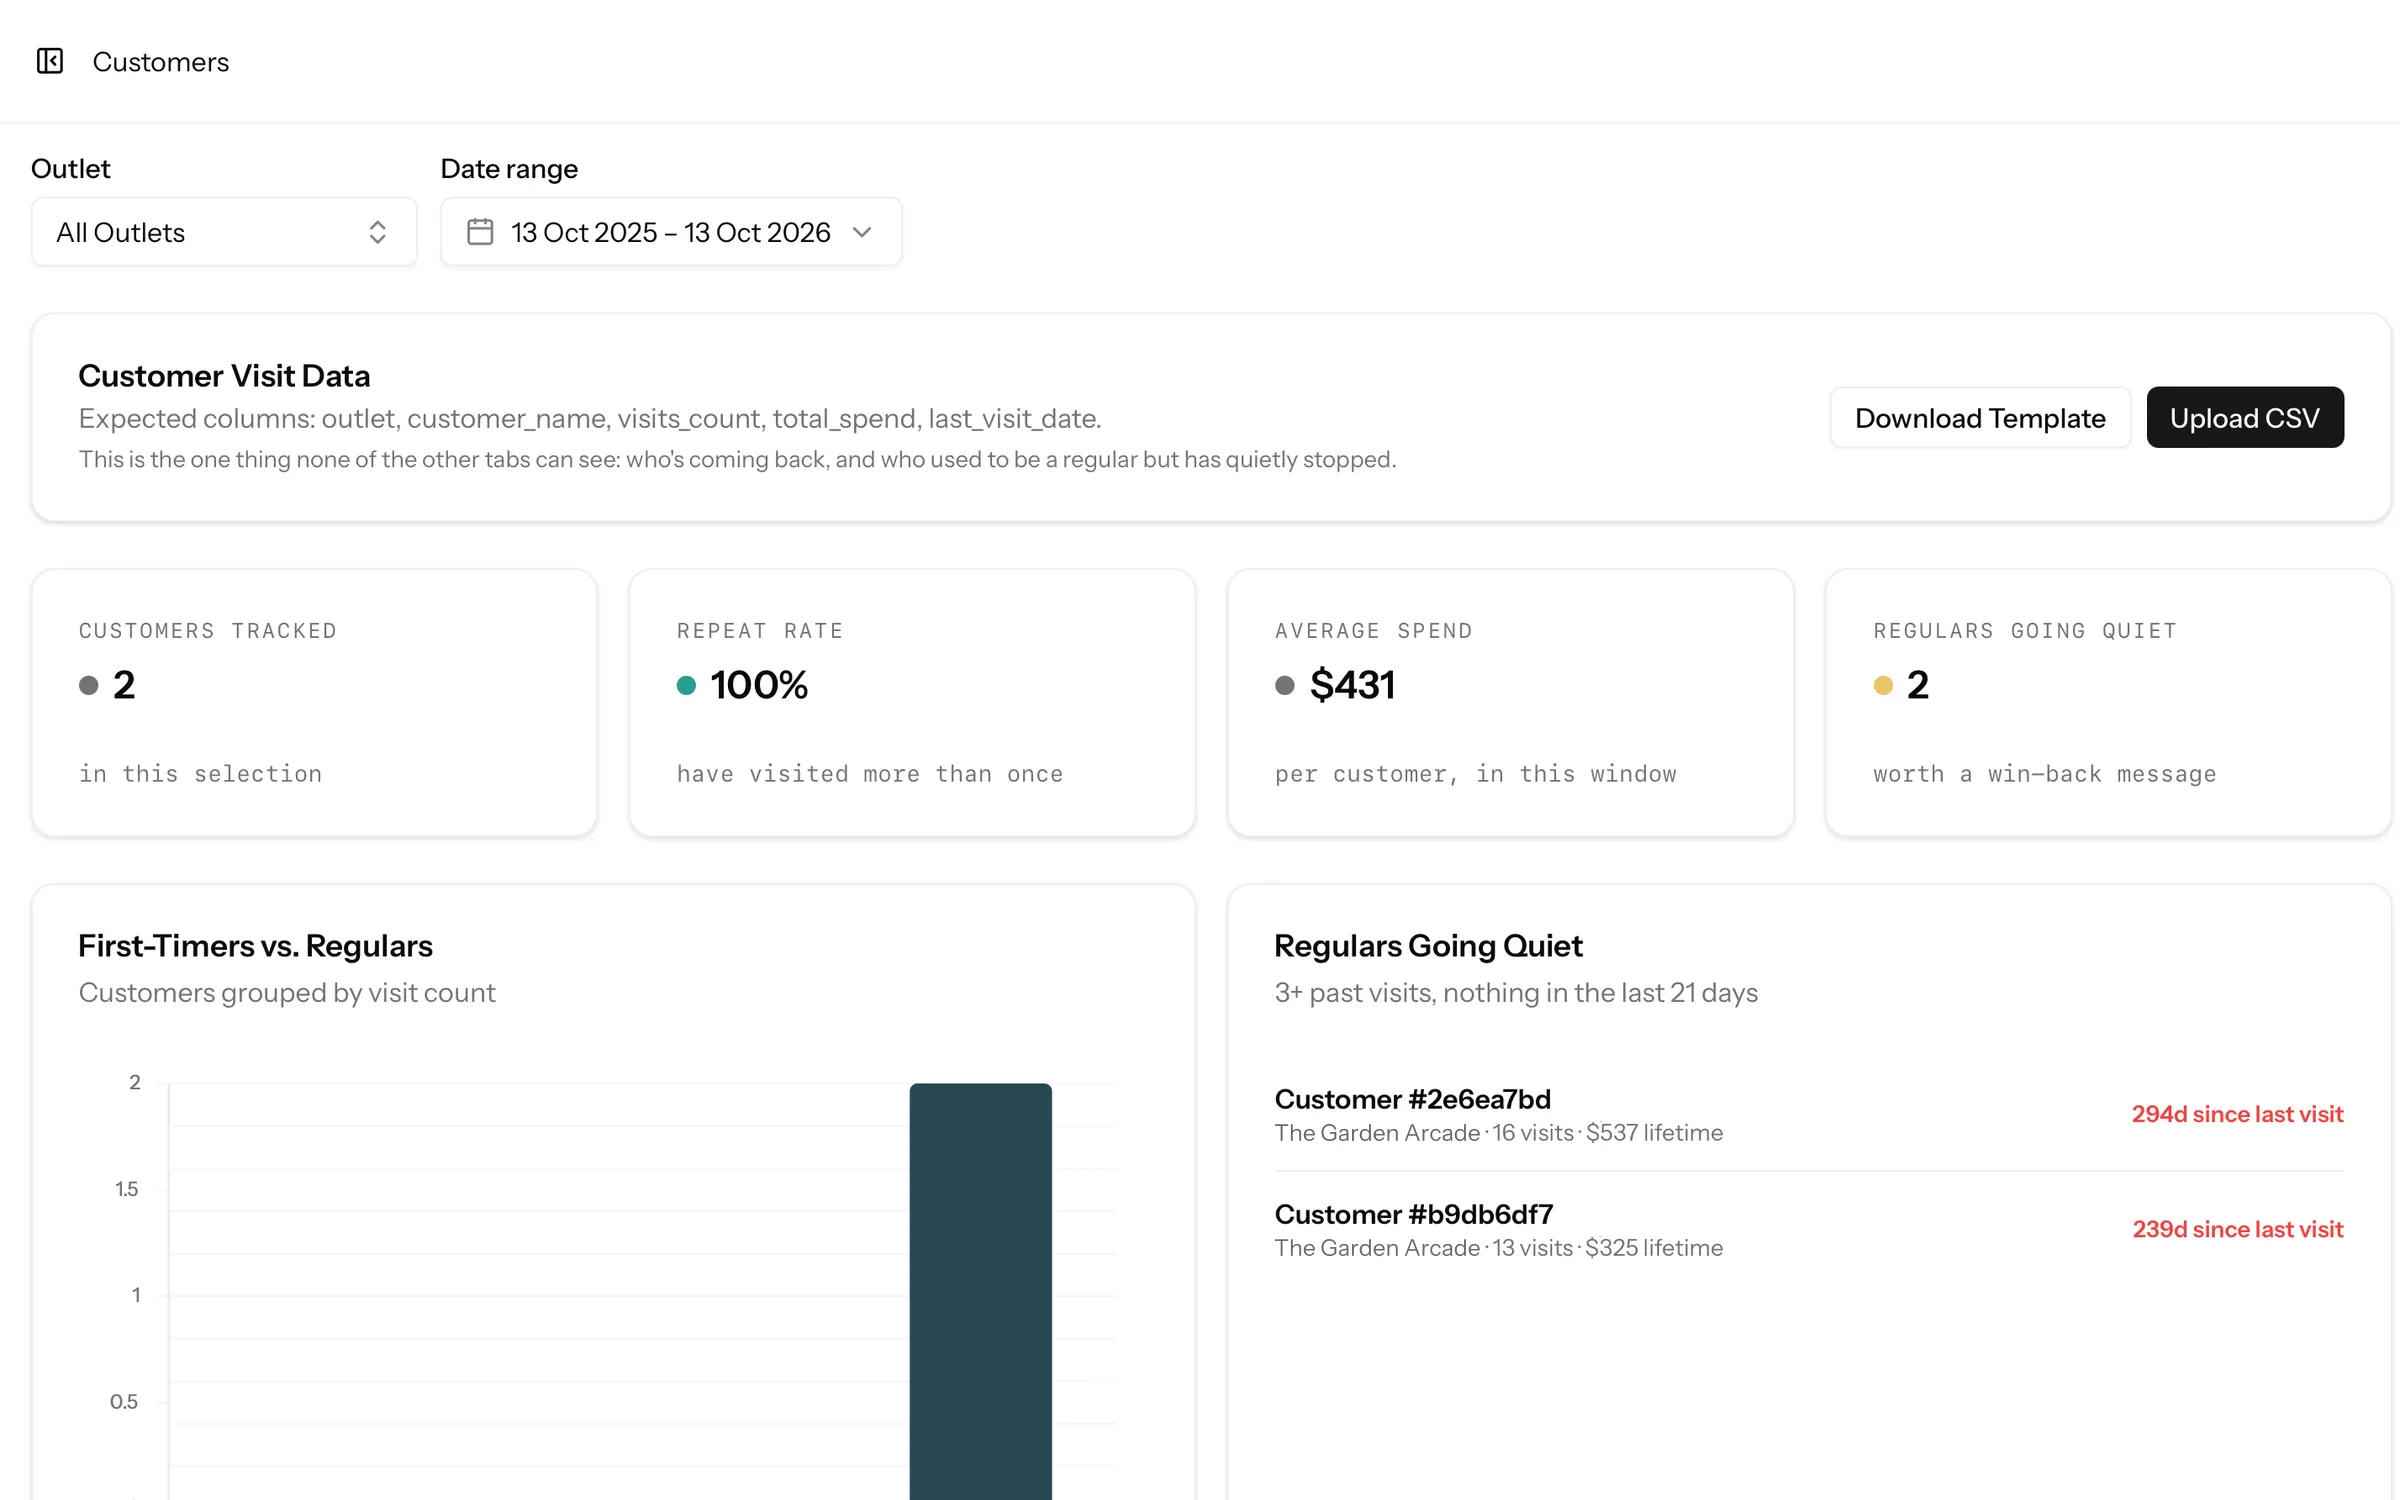
Sales data says how much. It doesn't say who's coming back. Backline splits first-timers from regulars and flags regulars who've gone quiet.
- First-timers vs regulars, per outlet
- Regulars going quiet: 3+ past visits, nothing in the last 21 days
- Built from the customer visit data you already hold. See Security & Data for what Backline reads.
Ask Avie
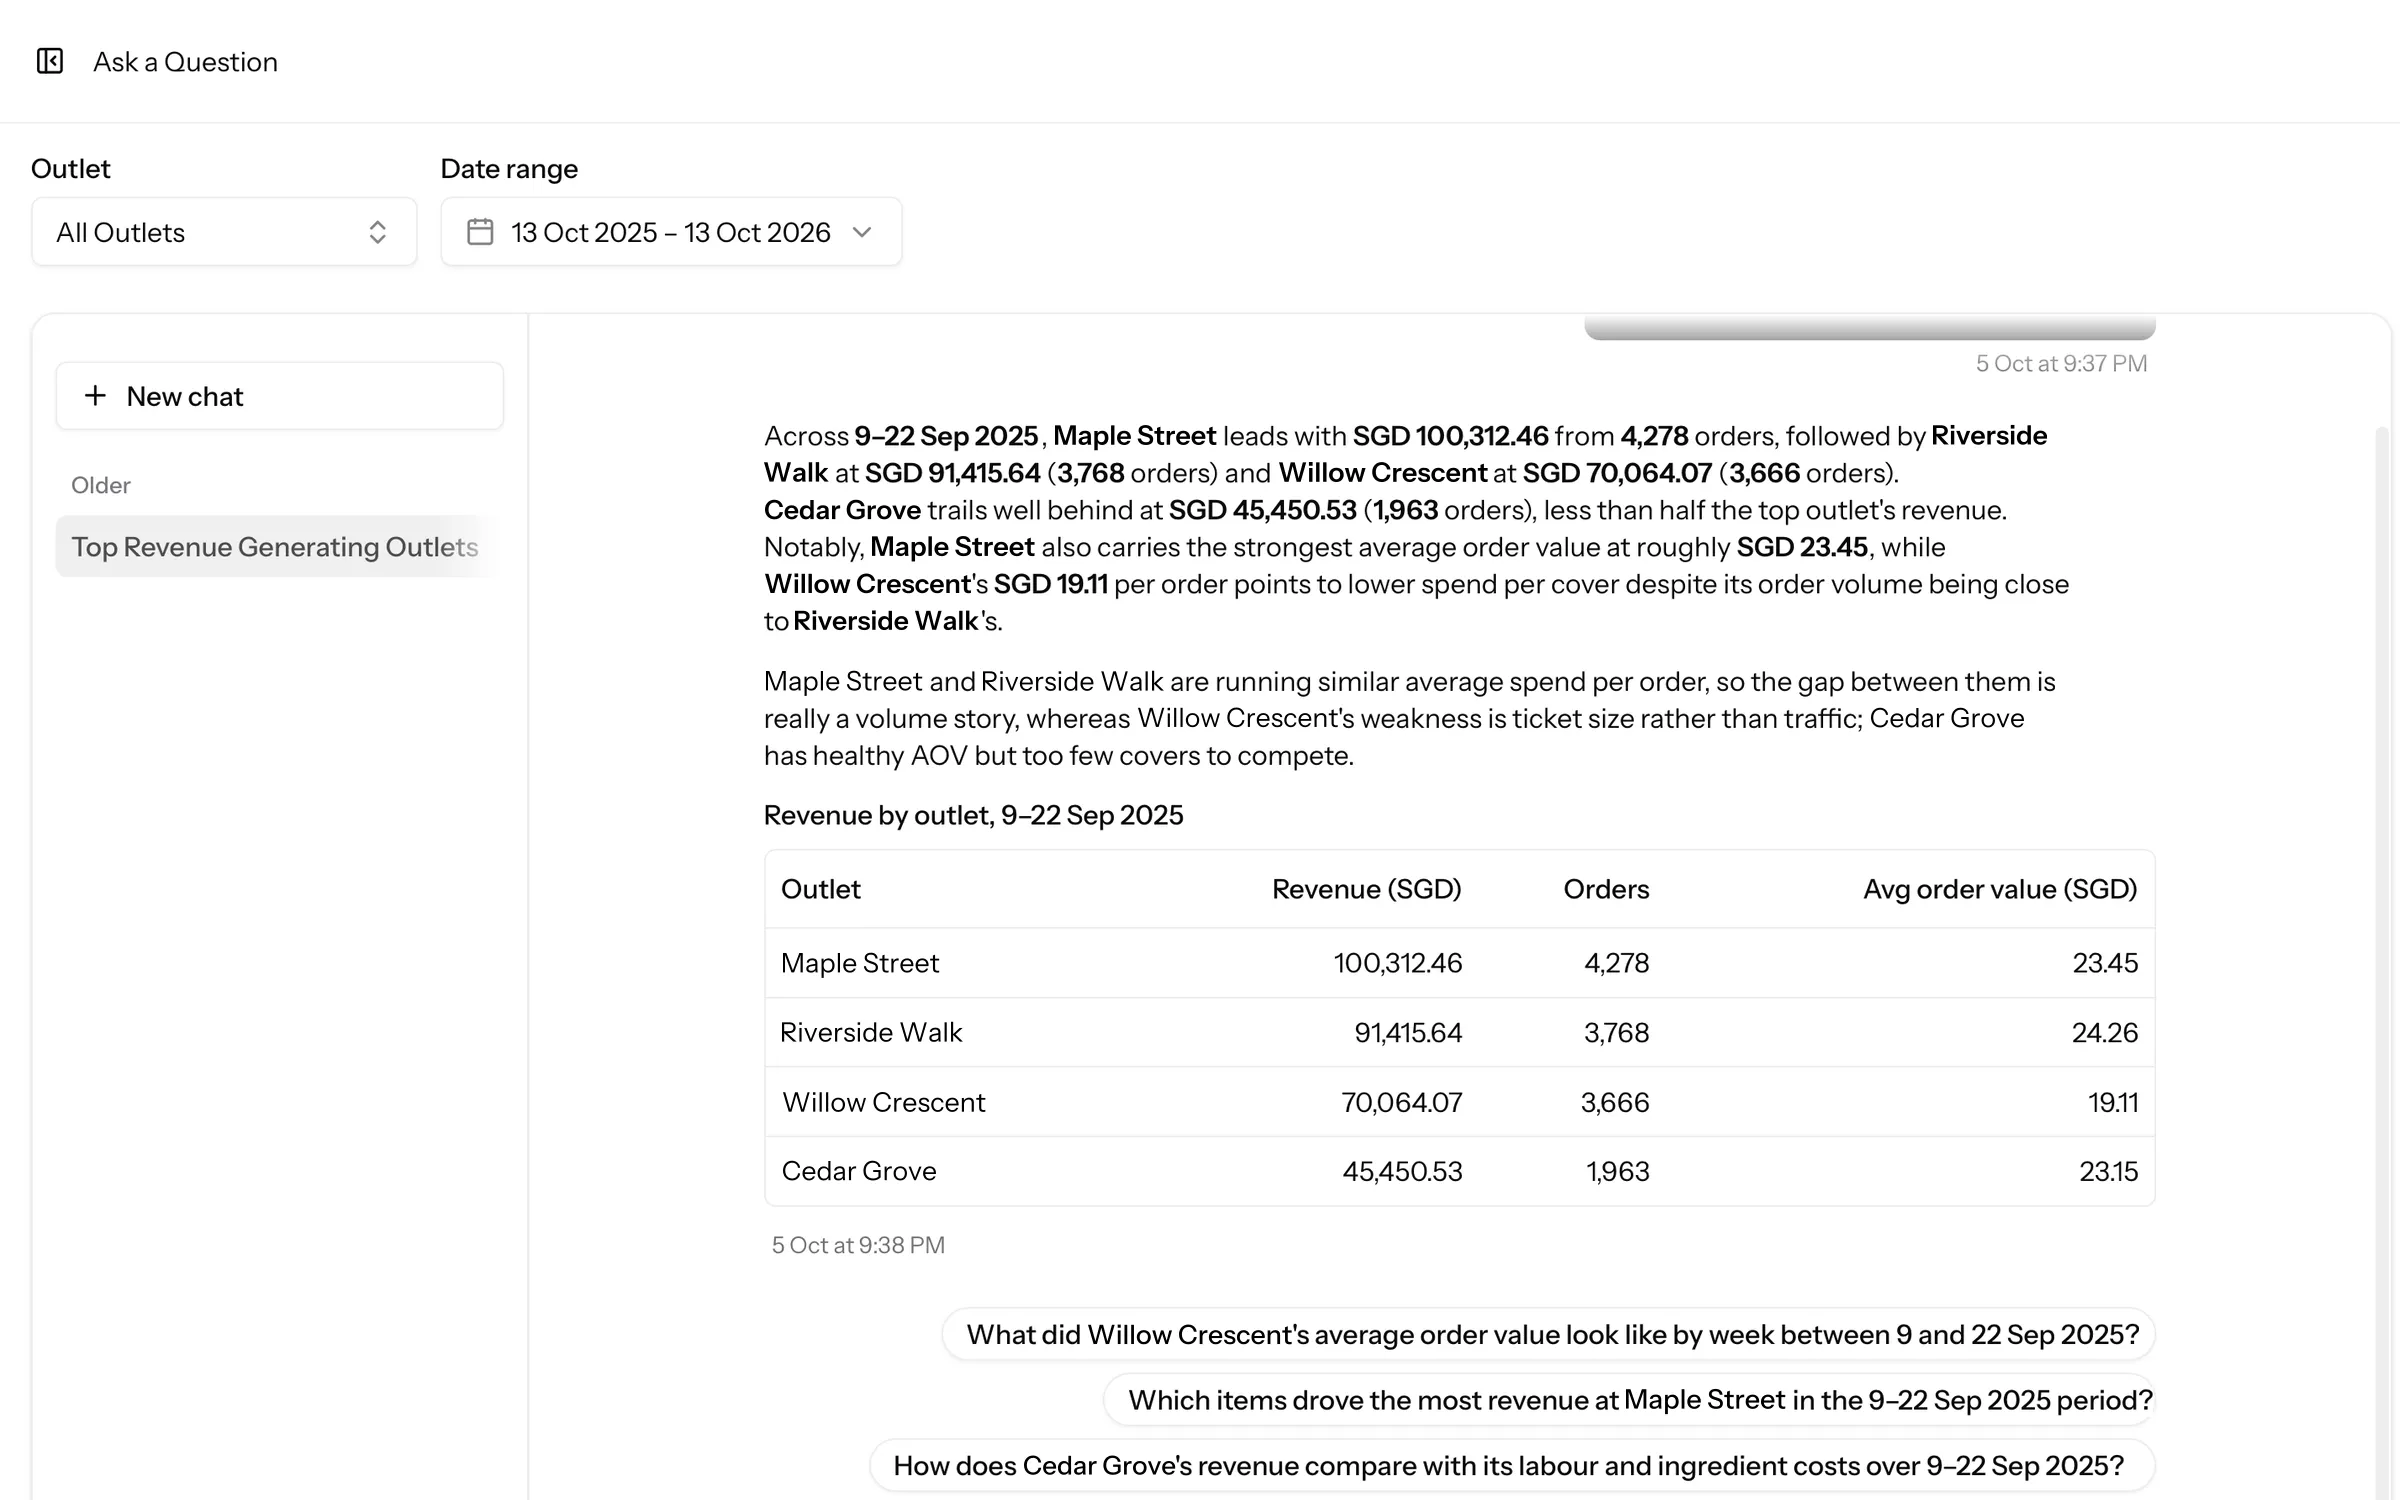
Ask a question. Get an answer from your own numbers.
Avie is Backline's assistant. It knows which page you're on and answers from your data, not the internet.
- "Which outlet is overstaffed this week?"
- "What items are losing money on Grab?"
- "Explain this page."
For the owner who wants an answer, not a new BI tool to learn.
Growth forecast · Estimate
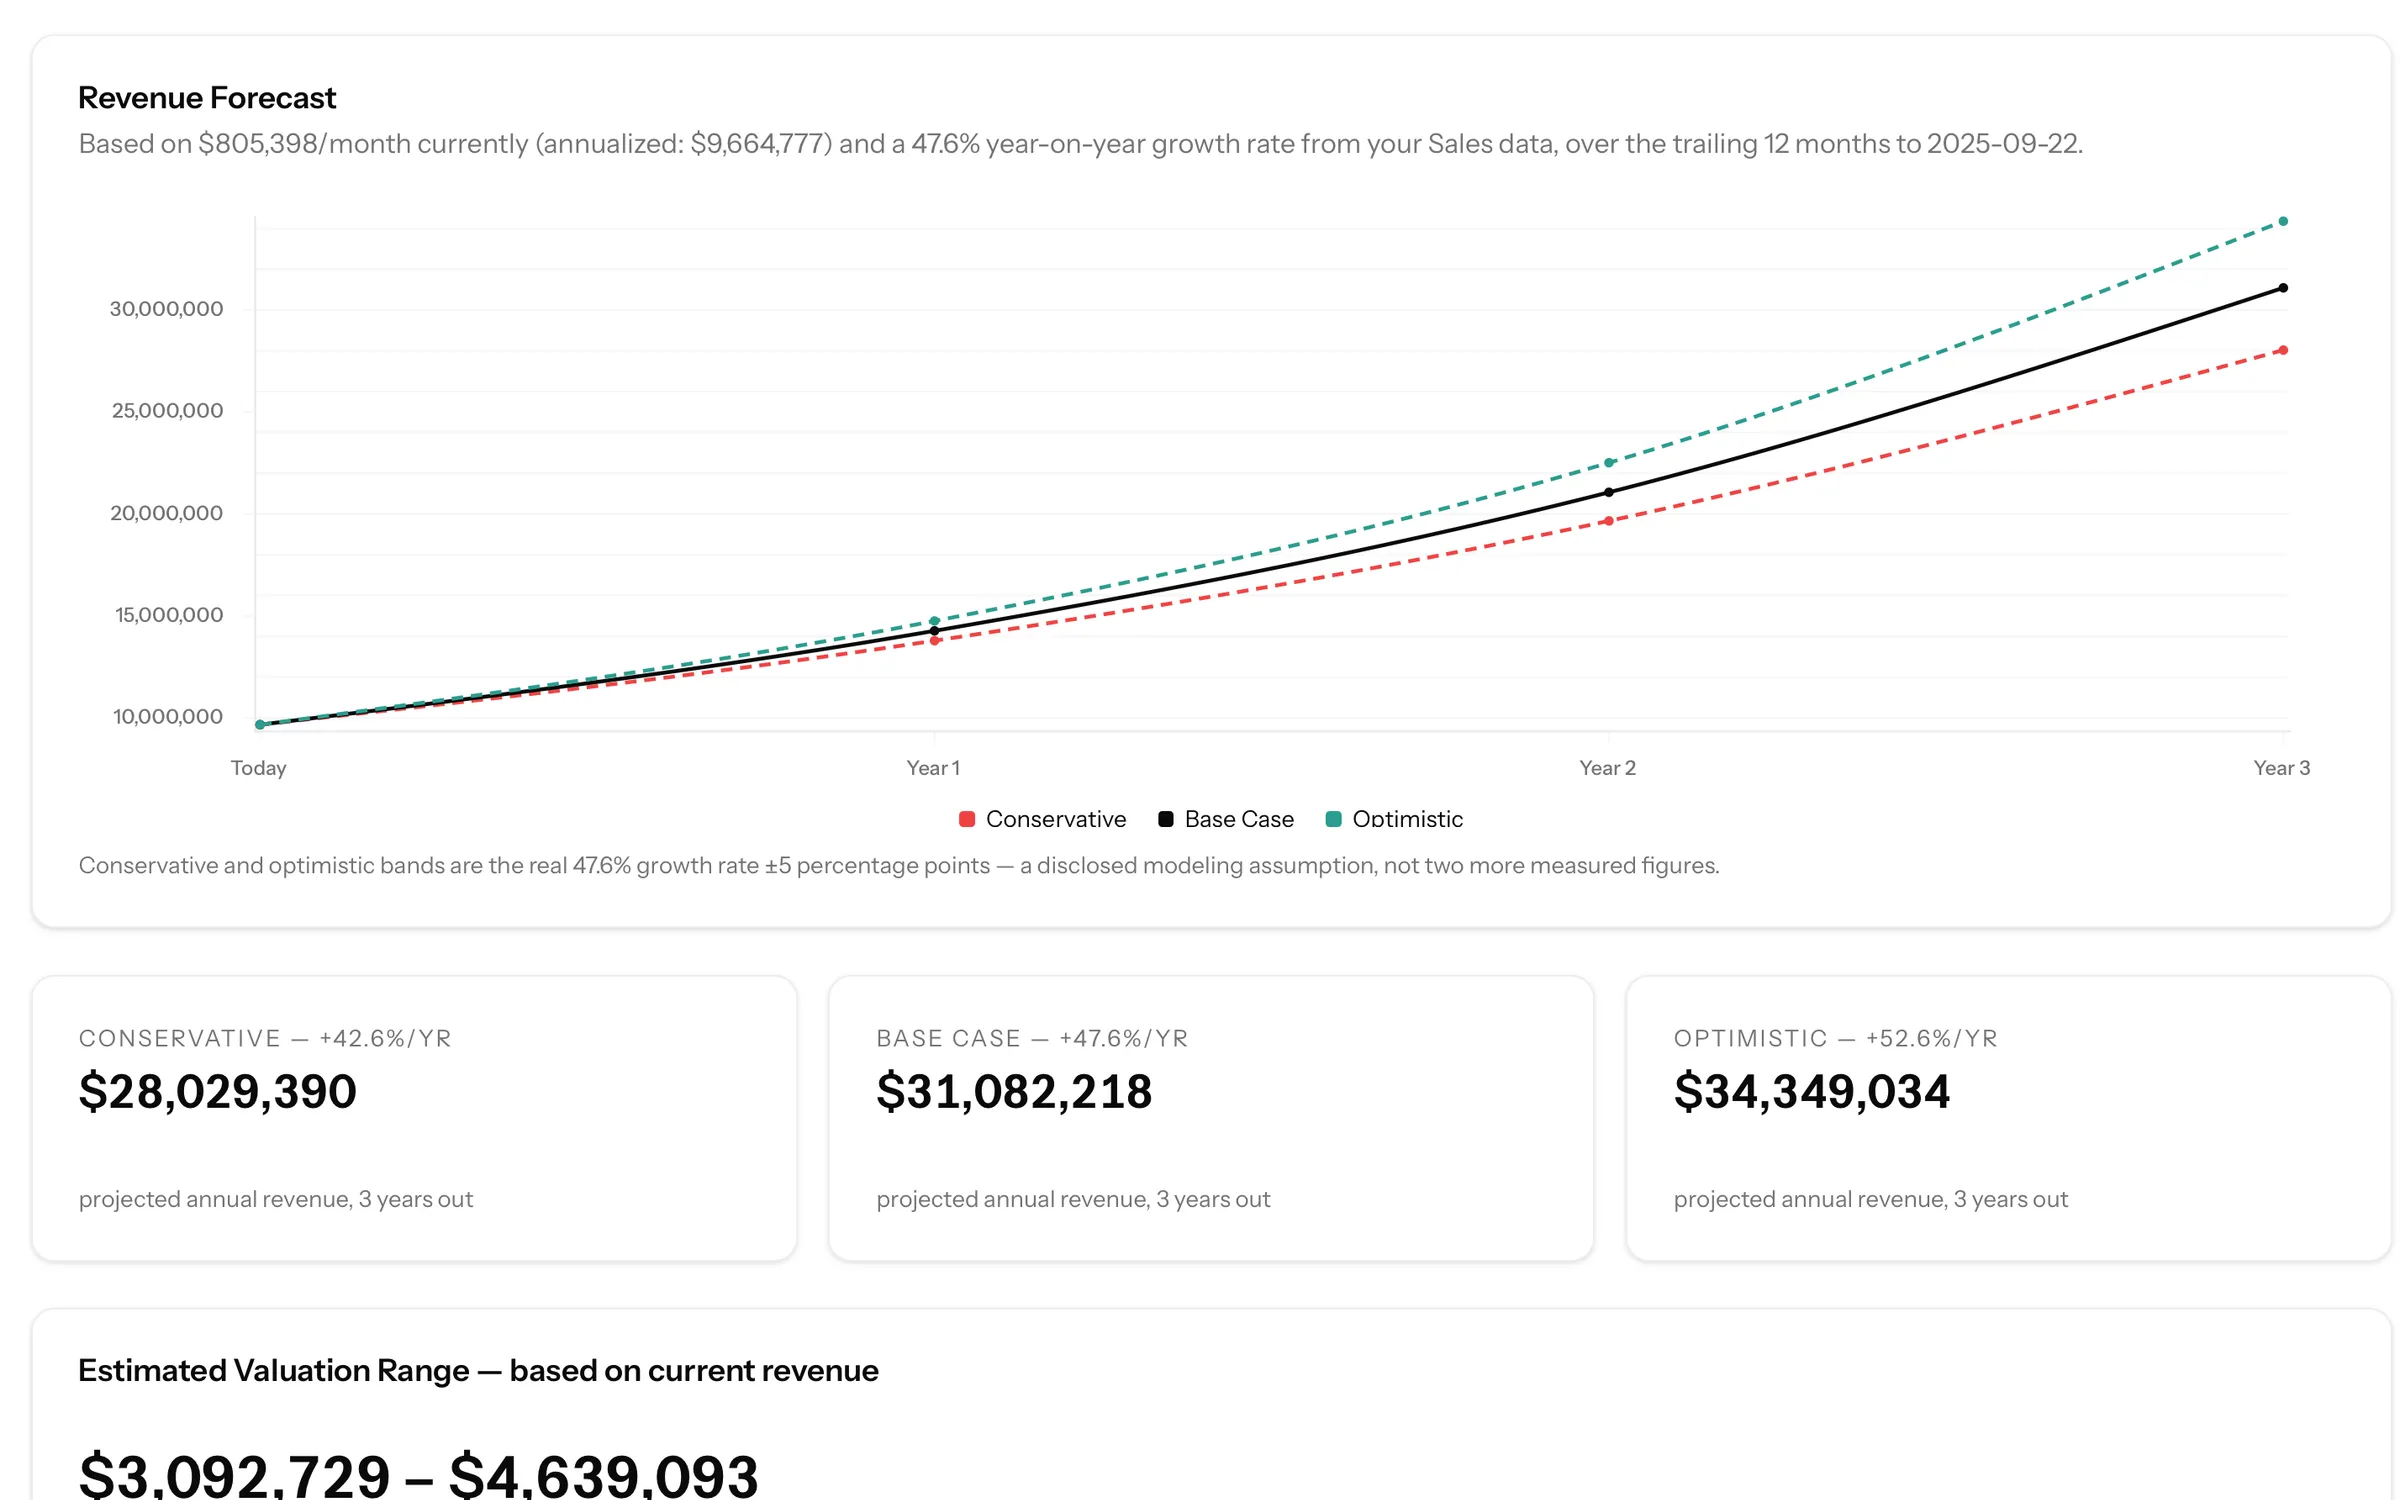
See where the business is heading, clearly labelled as an estimate.
A multi-year revenue projection built from your own trading history, with an estimated valuation range. It's useful for planning the next outlet or a conversation with your bank. It's never a promise.
- Multi-year revenue projection
- Estimated valuation range, always shown as a range
Estimate only. Not a valuation or financial advice.
See every outlet on one screen.
Book a demo and we'll walk you through Backline and how it would connect to the POS you already run.
Book a demoPricing depends on your number of outlets and setup. Book a demo for a quote.